EUR/JPY Price Analysis: Rallies sharply, invalidating a head-and-shoulders pattern
- EUR/JPY breaks head-and-shoulders neckline, bolstered by high EU inflation and hawkish ECB comments.
- The uptrend remains intact as the pair holds above the 20-day EMA, but further gains require a break above the month-to-date high.
EUR/JPY rallied sharply on Wednesday, breaking above a head-and-shoulders chart pattern neckline, invalidating the pattern, as buyers emerged on a high inflation report in the Eurozone (EU). That, alongside European Central Bank’s (ECB) hawkish commentary, opened the door for further gains. As the Asian session begins, the EUR/JPY trades at 149.17, registering a minuscule gain of 0.01%.
EUR/JPY Price Analysis: Technical outlook
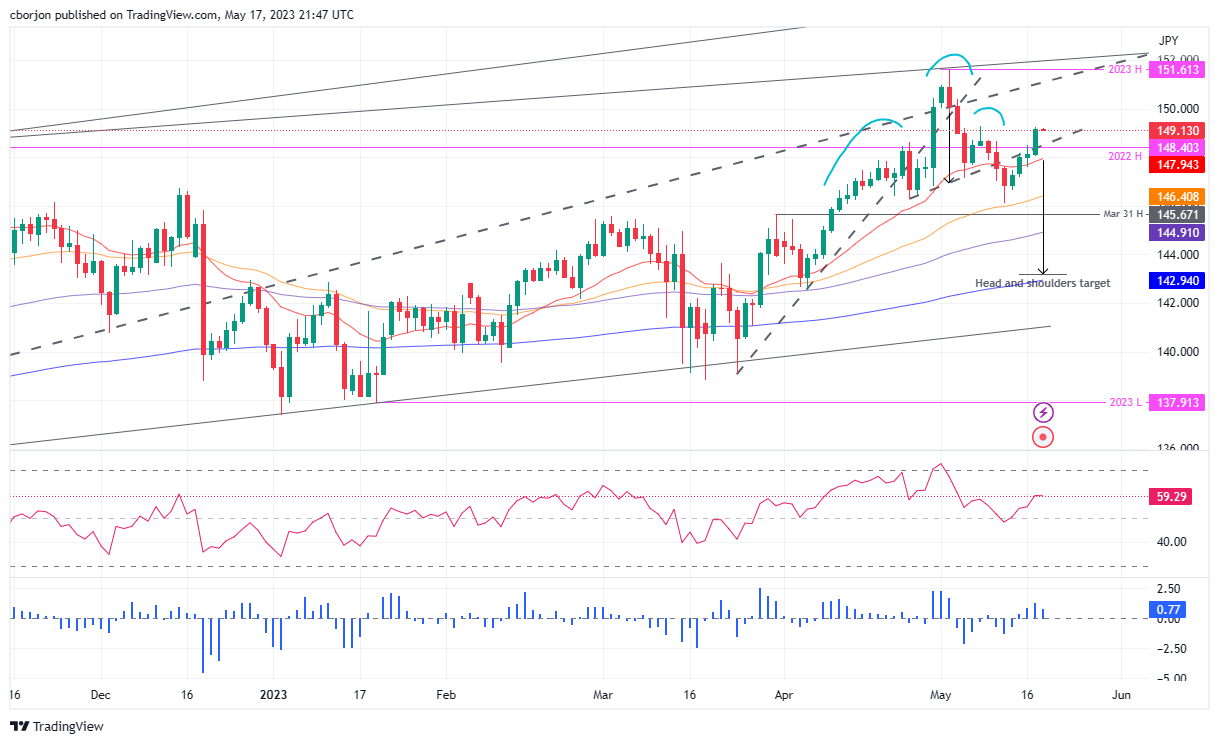
After the EUR/JPY struggled to crack the 2022 high of 148.40, the cross-currency pair extended its gains and cleared the neckline of a head-and-shoulders chart pattern. Therefore, the EUR/JPY’s uptrend remains intact in play, as also the pair jumped off the 20-day Exponential Moving Average (EMA) at 147.94. Nevertheless, to further cement its bias, a break above the month-to-date (MTD) high of 149.26 is needed, so the EUR/JPY could threaten to crack the 150.00 figure.
The Relative Strength Index (RSI) indicator shows buyers entered the market but has turned flat as the Asian session begins. The 3-day Rate of Change (RoC) portrays that buying pressure is fading; hence, mixed signals around the pair could prevent traders from opening fresh long positions.
On the upside, if EUR/JPY buyers reclaim 49.26, the psychological 150.00 figure is up for grabs. A breach of the latter will expose the year-to-date (YTD) high of 151.61.
Conversely, the EUR/JPY first support would be the 149.00 mark. Downside risks will emerge below the latter, like the 2022 high turned support at 148.40, ahead of the 20-day EMA at 147.94.
EUR/JPY Price Action – Daily chart