Back
25 Jun 2018
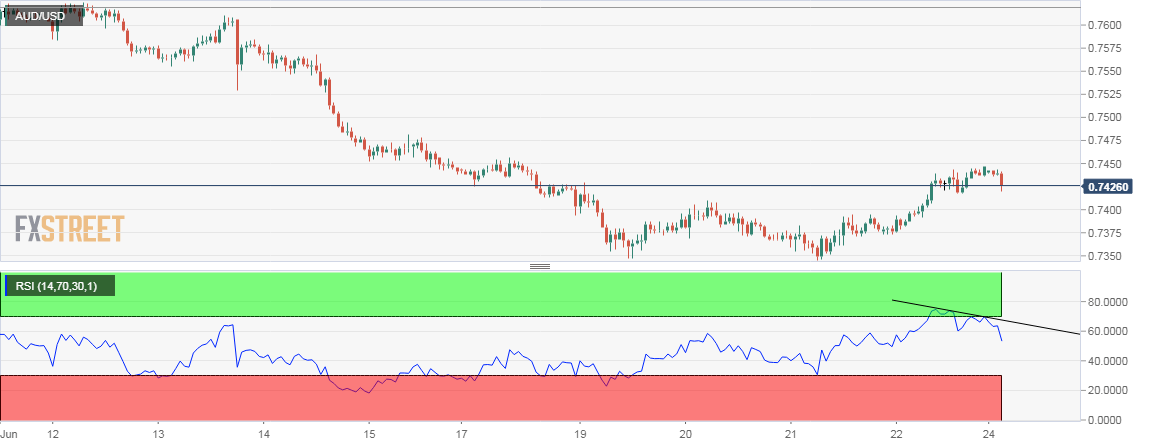
AUD/USD Technical Analysis: Bearish RSI divergence
- The AUD/USD hourly chart shows a bearish price-relative strength index (RSI) divergence.
- The bearish setup on the hourly chart adds credence to rejection at downward sloping (bearish) 50-candle moving average (MA) on 4-hour chart and descending (bearish) 10-day MA and indicates scope for a drop to 0.74.
Hourly chart
Spot Rate: 0.7422
Daily High: 0.7444
Daily Low: 0.7419
Trend: Bearish
Resistance
R1: 0.7444 (10-day MA)
R2: 0.7475 (May 29 low)
R3: 0.7543 (bearish 50-day MA)
Support
S1: 0.7399 (5-day MA)
S2: 0.7345 (June 21 low)
S3: 0.7319 (May 2017 low)