AUD/USD Review: 0.7450 capping off a move higher for a weakening Aussie
- The Aussie's bull-run from Friday appears over as the AUD/USD sheds its upwards momentum with traders awaiting fresh trade headlines.
- A weak economic calendar will have AUD traders looking forward to Wednesday's Aussie CPI figures.
The AUD/USD is chained to recent highs set late last week, cycling near 0.7430 as traders look down the barrel of a week that sees a thin data schedule and tensions on the rise across the globe with trade spats continuing to simmer.
Last week saw the Aussie whipping against the US Dollar, dropping into consecutive fresh lows before rebounding into near-term highs, and Friday's last bullish push on USD selling may face new challenges in the upcoming trading week as traders grapple with a thin economic calendar which will be leaving broader markets exposed to swings in market sentiment as the US-China trade war continues to edge closer to a new level, with further tariffs being promised by both sides and little action seen at the negotiation table.
Wednesday will be delivering Consumer Price Index figures for Australia, and the median market forecast is expecting a mild tick higher from 0.4% to 0.% for the headline q/q CPI reading for Q2 2018, but a lack of meaningful data before then will be seeing the AUD likely to be left in a weak position should wider fx markets resume bidding up the Greenback.
AUD/USD Technical Analysis
With the pair hesitating at medium-term resistance and bulls lacking the conviction to push the AUD/USD past the 0.7450 level, traders should keep an eye out for a fresh bearish slant to market action to bring the Aussie back down against the US Dollar as fx markets continue to be dominated by moves in the Greenback. Aussie bulls will be looking to mount a strong push from the 38.2% Fibo retracement level nearby, though a lack of momentum for the new week has the advantage going to sellers.
AUD/USD Chart, 15-Minute
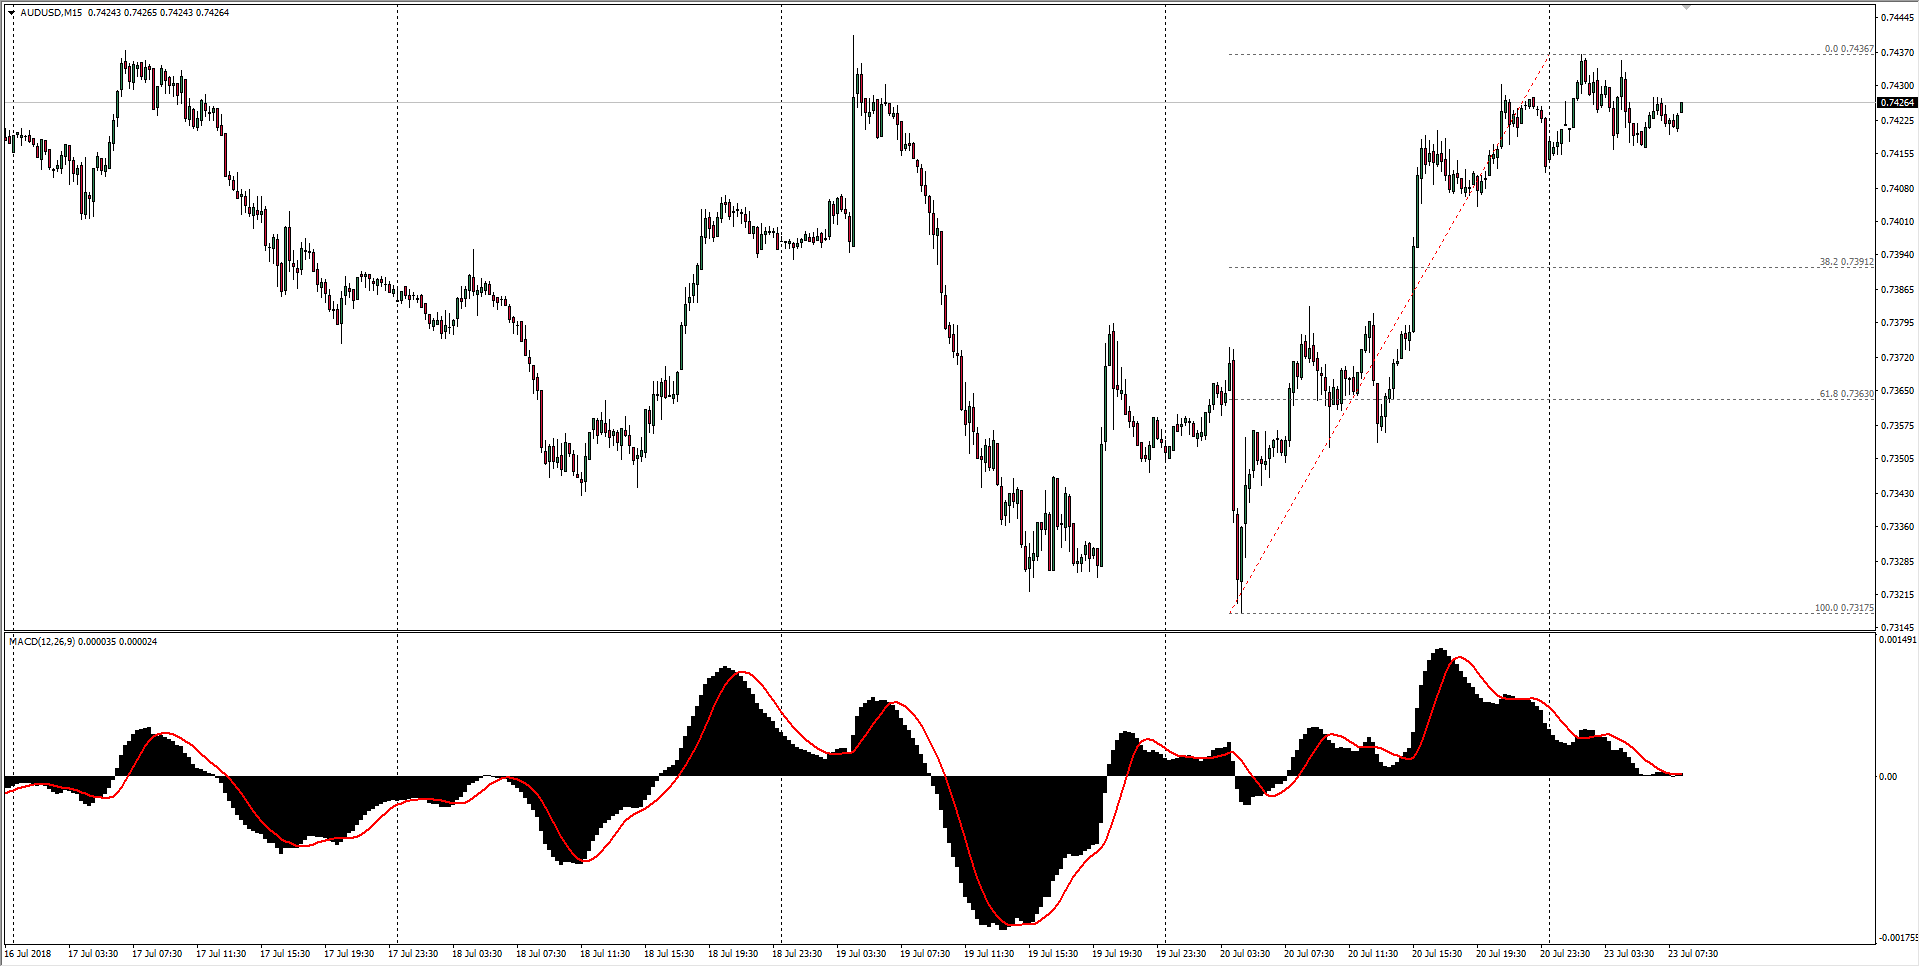
| Spot rate: | 0.7426 |
| Relative change: | 0.16% |
| High: | 0.7436 |
| Low: | 0.7414 |
| Trend: | Flat to bearish |
| Support 1: | 0.7391 (38.2% Fibo retracement level) |
| Support 2: | 0.7353 (common constraint level) |
| Support 3: | 0.7317 (previous week low) |
| Resistance 1: | 0.7440 (July 19th swing high) |
| Resistance 2: | 0.7483 (July high) |
| Resistance 3: | 0.7504 (R2 daily pivot) |