GBP/USD Technical Analysis: Cable reaches a new 2018 low to 1.2853 level
- GBP/USD lost almost 90 pips on Wednesday, reaching yet again a new 2018 low testing August 31, 2017 low.
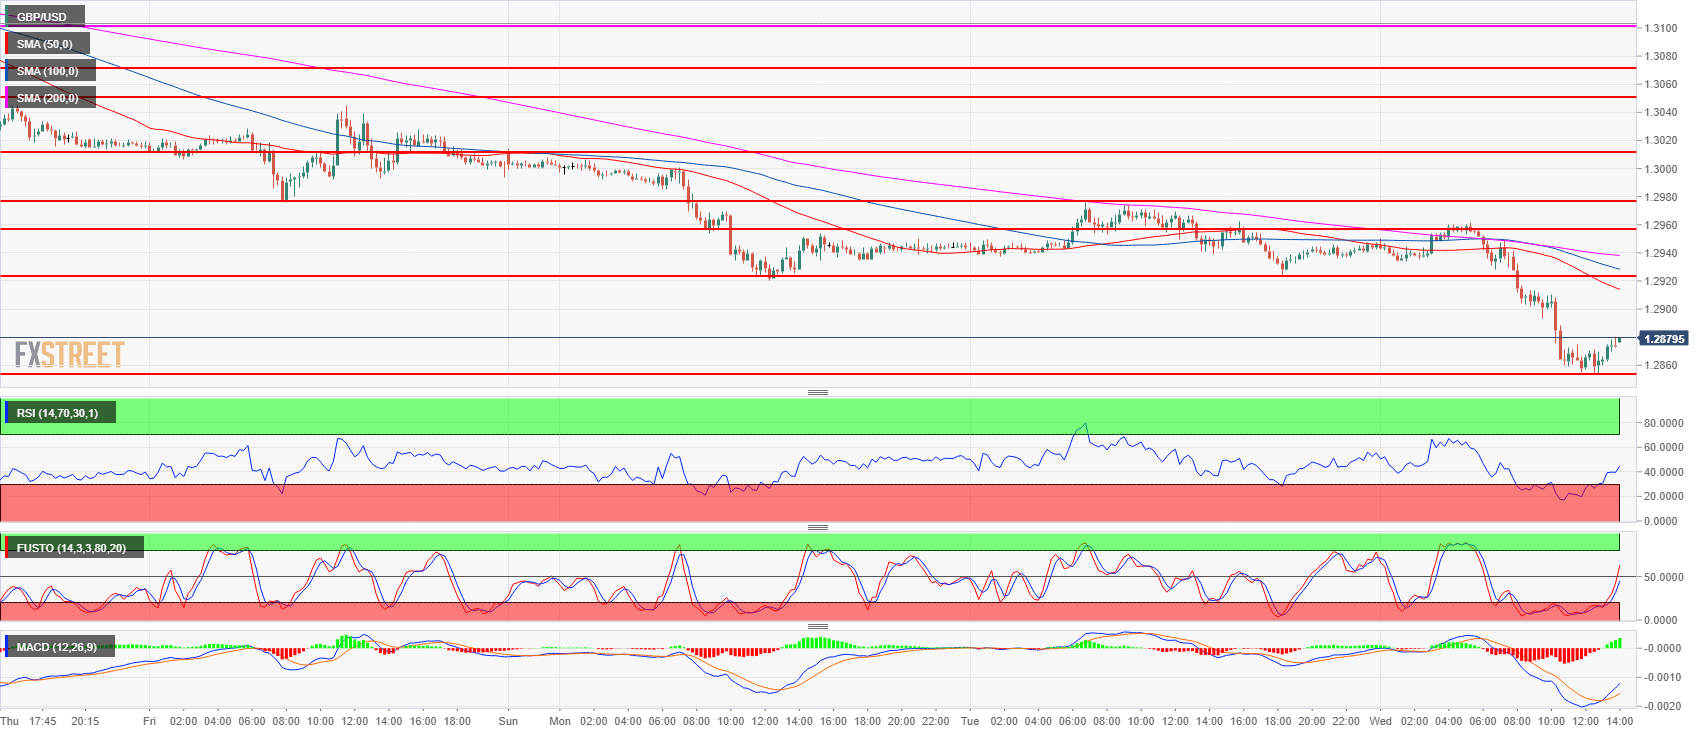
- As GBP/USD sell-off was fairly parabolic the currency is taking a breather and is currently in bullish pullback mode above the new 2018 low. Resistances to the upside are likely located near the 1.2900 figure and 1.2923 Tuesday’s low. Bears targets to the downside are now located at 1.2853 (2018 low) and 1.2774 August 24, 2017 low.
GBP/USD 15-minute chart
GBP/USD daily chart

Spot rate: 1.2878
Relative change: -0.47%
High: 1.2961
Low: 1.2853
Trend: Bearish / Bullish pullback above 1.2853 August 8, low (2018 low)
Resistance 1: 1.2900-1.2923 area, figure and August 7 low
Resistance 2: 1.2957 July 17 low
Resistance 3: 1.2975 August 3 low
Resistance 4: 1.3000-1.3010 area, figure and July 18 low
Resistance 5: 1.3049 June 28 low
Resistance 6: 1.3100-1.3076 area, figure and July 24 low
Resistance 7: 1.3155 former breakout point
Resistance 8: 1.3200 figure
Resistance 9: 1.3230 supply level
Resistance 10: 1.3250 June 4 high
Support 1: 1.2853 August 8, low (2018 low)
Support 2: 1.2774 August 24, 2017 low
Support 3: 1.2700 figure