Gold Review: Struggles near 19-month low, chart set-up points to continuation of the downfall
• Subdued USD offset by positive US bond yields and continues to weigh.
• Fading safe-haven demand further contributes to the lacklustre trading.
Gold seesawed between tepid gains/minor losses through the mid-European session and was seen consolidating overnight slump to the lowest level since late-Jan. 2017.
Despite a rout across global financial markets, triggered by crashing Turkish Lira, the precious metal came under some intense selling pressure on Monday and finally broke below the $1200 psychological round figure mark.
The ongoing US Dollar upsurge, further supported by a goodish pickup in the US Treasury bond yields, was seen as one of the key factors exerting some heavy selling pressure around the dollar-denominated/non-yielding yellow metal.
However, a combination of diverging forces failed to provide any fresh impetus and led to subdued/range-bound price action on Tuesday. The USD bullish run seems to have paused and extended some support, albeit was largely negated by a follow-through pickup in the US bond yields.
This coupled with some signs of stability in equity markets, as depicted by a modest rebound across European bourses, further dented the precious metal's safe-haven appeal and might continue to keep a lid on any attempted recovery.
It would now be interesting to see if the commodity is able to find any buying interest or continues with its consolidative price action amid absent major market-moving economic releases from the US.
Technical Analysis
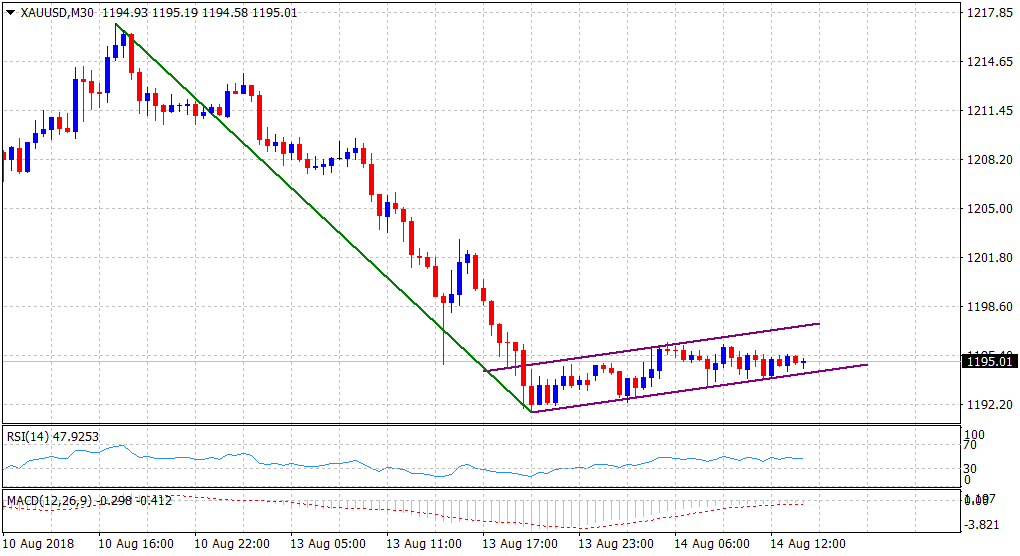
Overnight slide marked a bearish breakdown below a one-week-old trading range and subsequent price-action now seems to constitute towards the formation of a bearish flag chart pattern on the 30-min chart. Hence, any recovery attempt seems more likely to get sold into and the commodity remains vulnerable to extend its well-established downward trajectory.
A follow-through weakness below $1194 area would confirm the bearish outlook and turn the commodity vulnerable to accelerate the slide towards $1181 intermediate level en-route its next major support near the $1165-63 region.