Back
31 Jan 2019
US Dollar IndexTechnical Analysis: DXY bulls drive the market up to 95.63 resistance
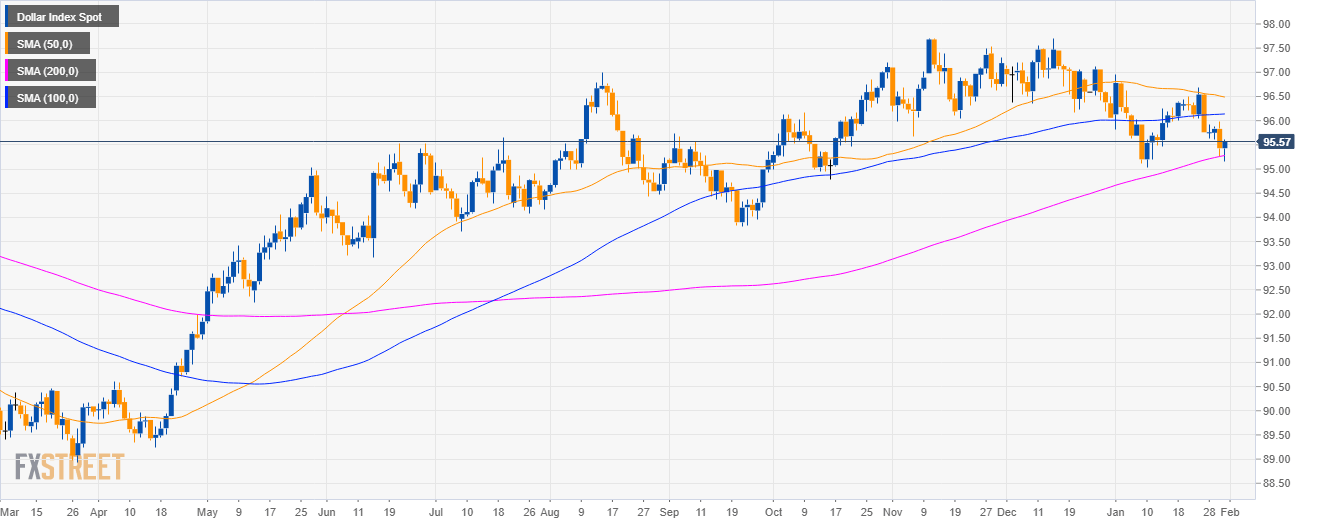
DXY daily chart
- The US Dollar Index (DXY) is in a bull trend above 200-day simple moving average (SMA).
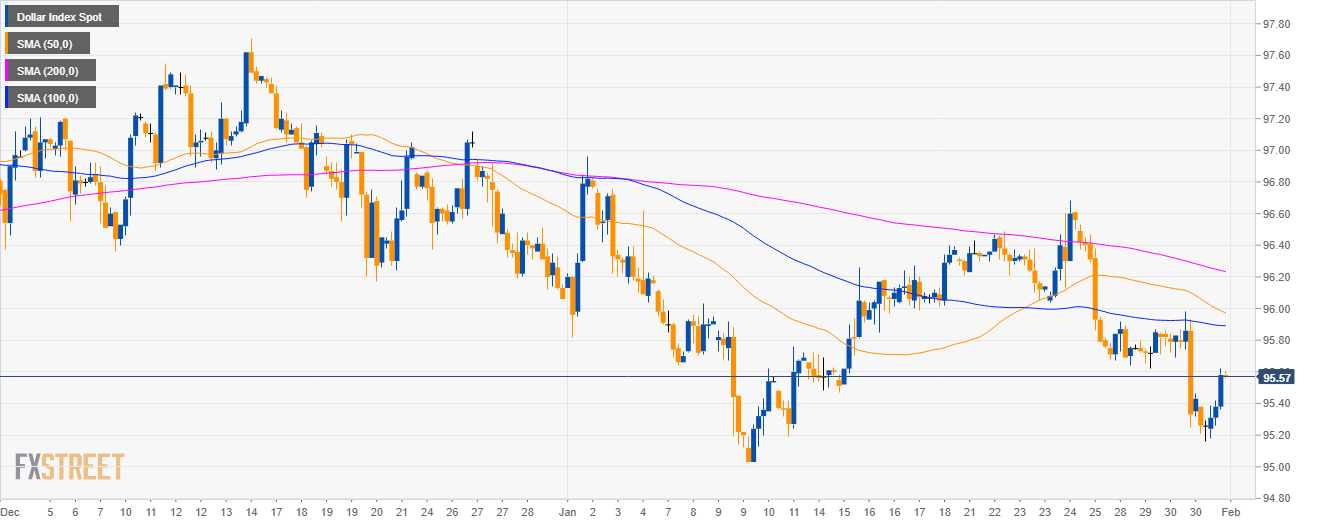
DXY 4-hour chart
- DXY is trading below its main SMAs suggesting a bearish bias in the medium-term.
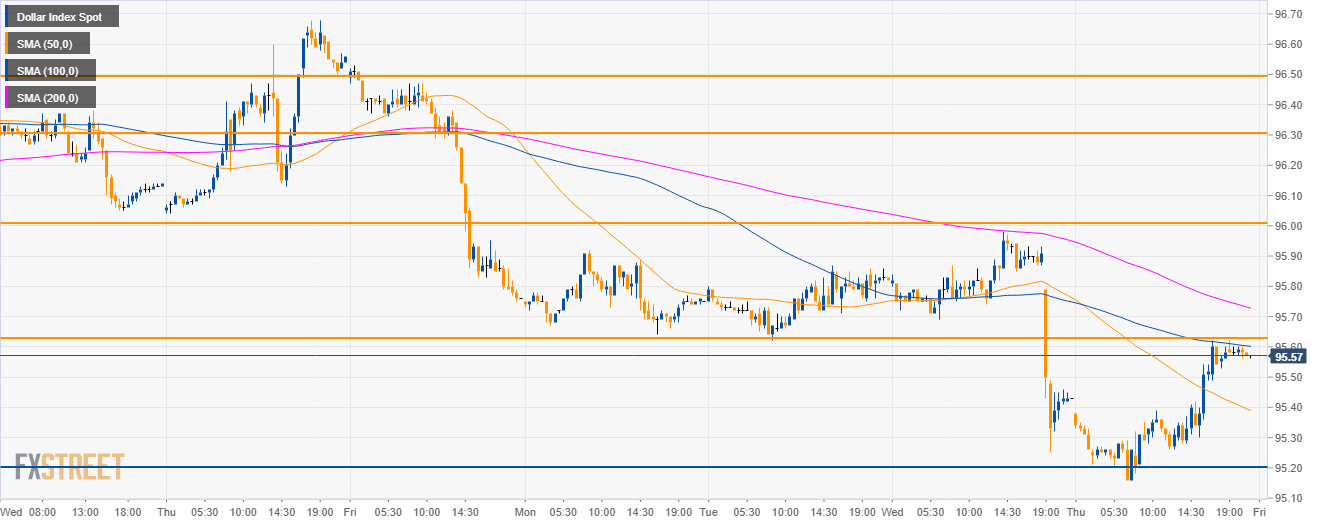
DXY 30-minute chart
- DXY found resistance at 95.63 and the 50 SMA. A break above this level is needed for DXY bulls to extend Thursday's bull move to 96.00 figure.
- If bears keep DXY below the 95.63 resistance they can target the 95.20 level.
Additional key levels
Dollar Index Spot
Overview:
Today Last Price: 95.57
Today Daily change %: 0.15%
Today Daily Open: 95.43
Trends:
Daily SMA20: 95.94
Daily SMA50: 96.51
Daily SMA100: 96.13
Daily SMA200: 95.26
Levels:
Previous Daily High: 95.98
Previous Daily Low: 95.25
Previous Weekly High: 96.68
Previous Weekly Low: 95.75
Previous Monthly High: 97.71
Previous Monthly Low: 96.06
Daily Fibonacci 38.2%: 95.53
Daily Fibonacci 61.8%: 95.7
Daily Pivot Point S1: 95.13
Daily Pivot Point S2: 94.82
Daily Pivot Point S3: 94.4
Daily Pivot Point R1: 95.86
Daily Pivot Point R2: 96.28
Daily Pivot Point R3: 96.59