GBP/USD Technical Analysis: Cable slowly approaching 1.3000 figure
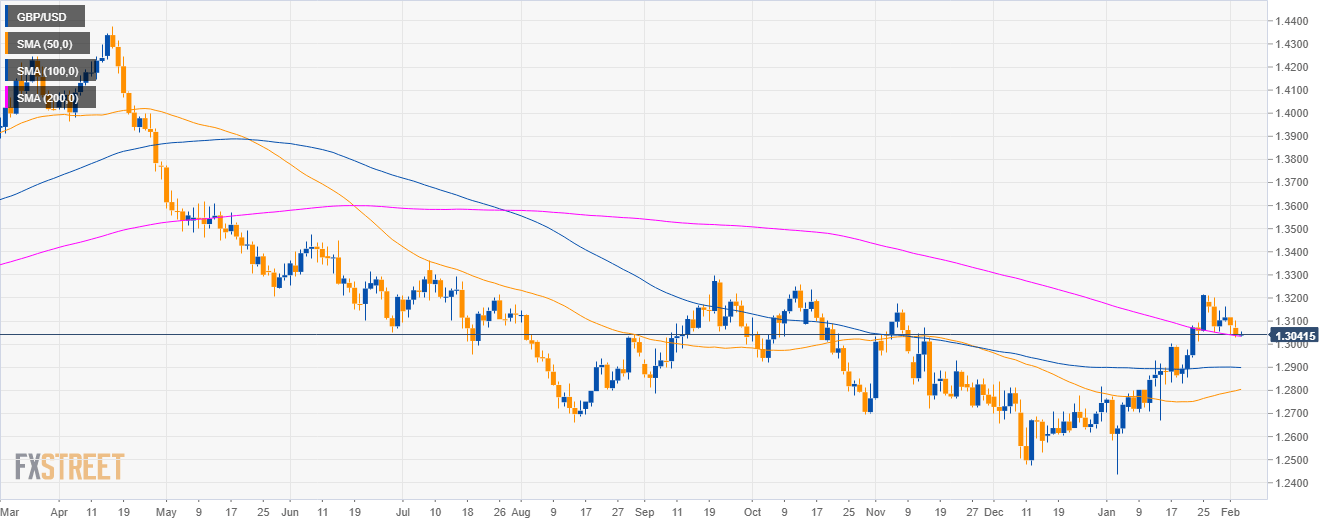
GBP/USD daily chart
- GBP/USD is trading just above its 200-day simple moving average.
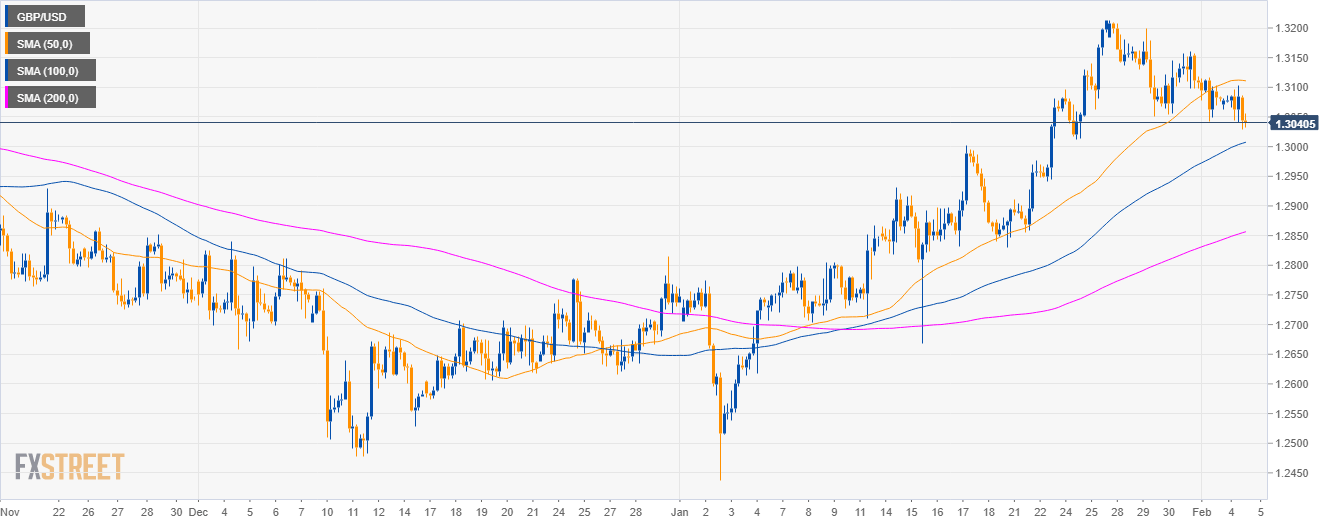
GBP/USD 4-hour chart
- GBP/USD is trading above the 100 and 200 SMAs suggesting a bullish bias in the medium-term.
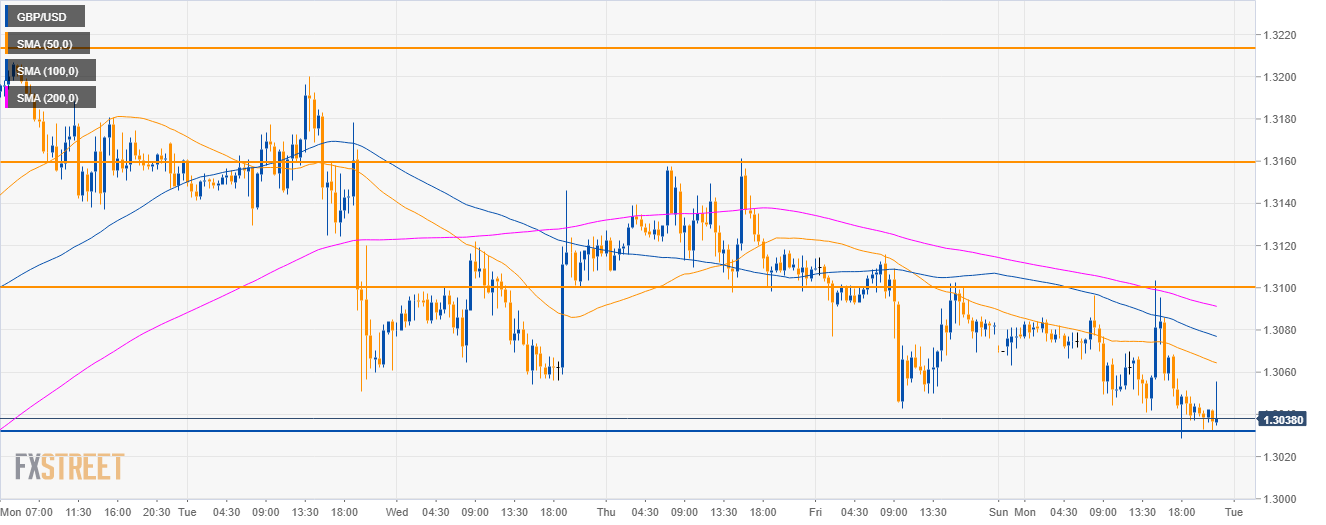
GBP/USD 30-minute chart
- GBP/USD is trading below its main SMAs suggesting bearish bias in the near-term.
- GBP bears will need to break 1.3020 to reach 1.2990 and 1.2930 to the downside.
- Alternatively, to the upside traders should find resistance at 1.3100 and the 1.3160 level. Tuesday might favor the bulls.
Additional key levels
GBP/USD
Overview:
Today Last Price: 1.3041
Today Daily change: -41 pips
Today Daily change %: -0.31%
Today Daily Open: 1.3082
Trends:
Daily SMA20: 1.2955
Daily SMA50: 1.2794
Daily SMA100: 1.2901
Daily SMA200: 1.3041
Levels:
Previous Daily High: 1.3118
Previous Daily Low: 1.3043
Previous Weekly High: 1.3212
Previous Weekly Low: 1.3043
Previous Monthly High: 1.3214
Previous Monthly Low: 1.2438
Daily Fibonacci 38.2%: 1.3071
Daily Fibonacci 61.8%: 1.3089
Daily Pivot Point S1: 1.3044
Daily Pivot Point S2: 1.3006
Daily Pivot Point S3: 1.297
Daily Pivot Point R1: 1.3119
Daily Pivot Point R2: 1.3155
Daily Pivot Point R3: 1.3193