USD/INR technical analysis: Sellers eye 3-week old support-line as MACD about to turn bearish
- USD/INR remains firm above near-term support-line but fails to clear 61.8% Fibonacci retracement.
- MACD is about to flash bearish signal, highlighting the importance of immediate trend-line support and 21-DMA.
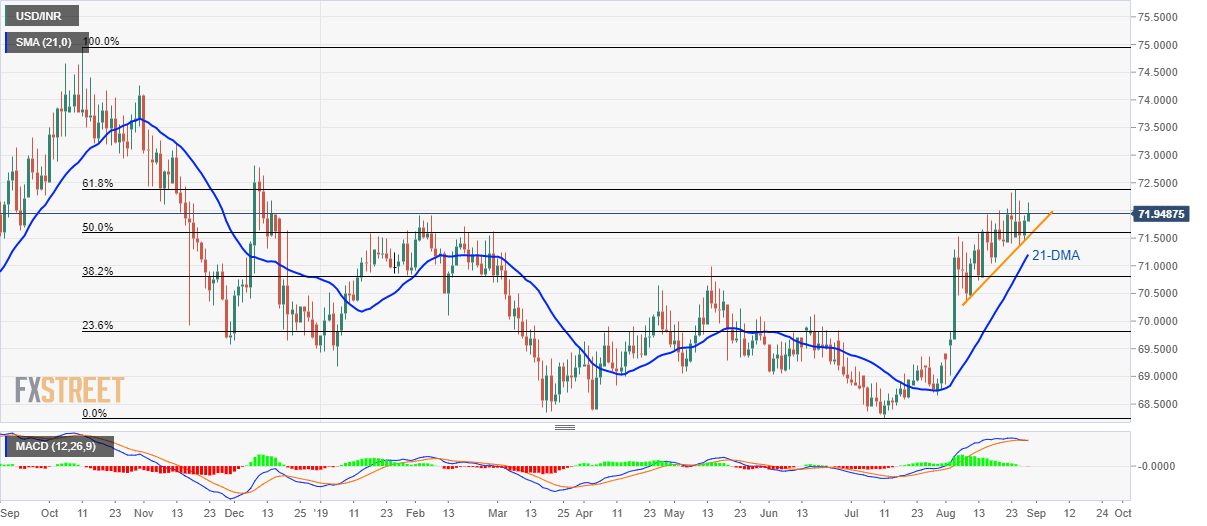
The USD/INR pair’s failure to rise past-61.8% Fibonacci retracement of 2018 peak to current year bottom will soon be joined by a bearish signal from the 12-day moving average convergence and divergence (MACD) as it makes the rounds to 71.95 ahead of Thursday’s European session.
As a result, the quote might witness a pullback towards three-week-old support-line, at 71.52, whereas 21-day simple moving average (DMA) could restrict the pair’s further declines around 71.20.
In a case where prices fail to respect 71.20 mark, 38.2% Fibonacci retracement level of 70.80 and June month high surrounding 70.12 can lure USD/INR sellers.
On the upside break of 61.8% Fibonacci retracement level near 72.40, prices can rise to December 2018 high of 72.82.
USD/INR daily chart

Trend: pullback expected
