Back


11 Sep 2019
US Dollar Index technical analysis: DXY breaks to 4-day high and hits 98.68 level in the New York session
- DXY (US Dollar Index) breaks the 98.55 level to the upside.
- The level to beat for buyers is at the 98.68 resistance level.
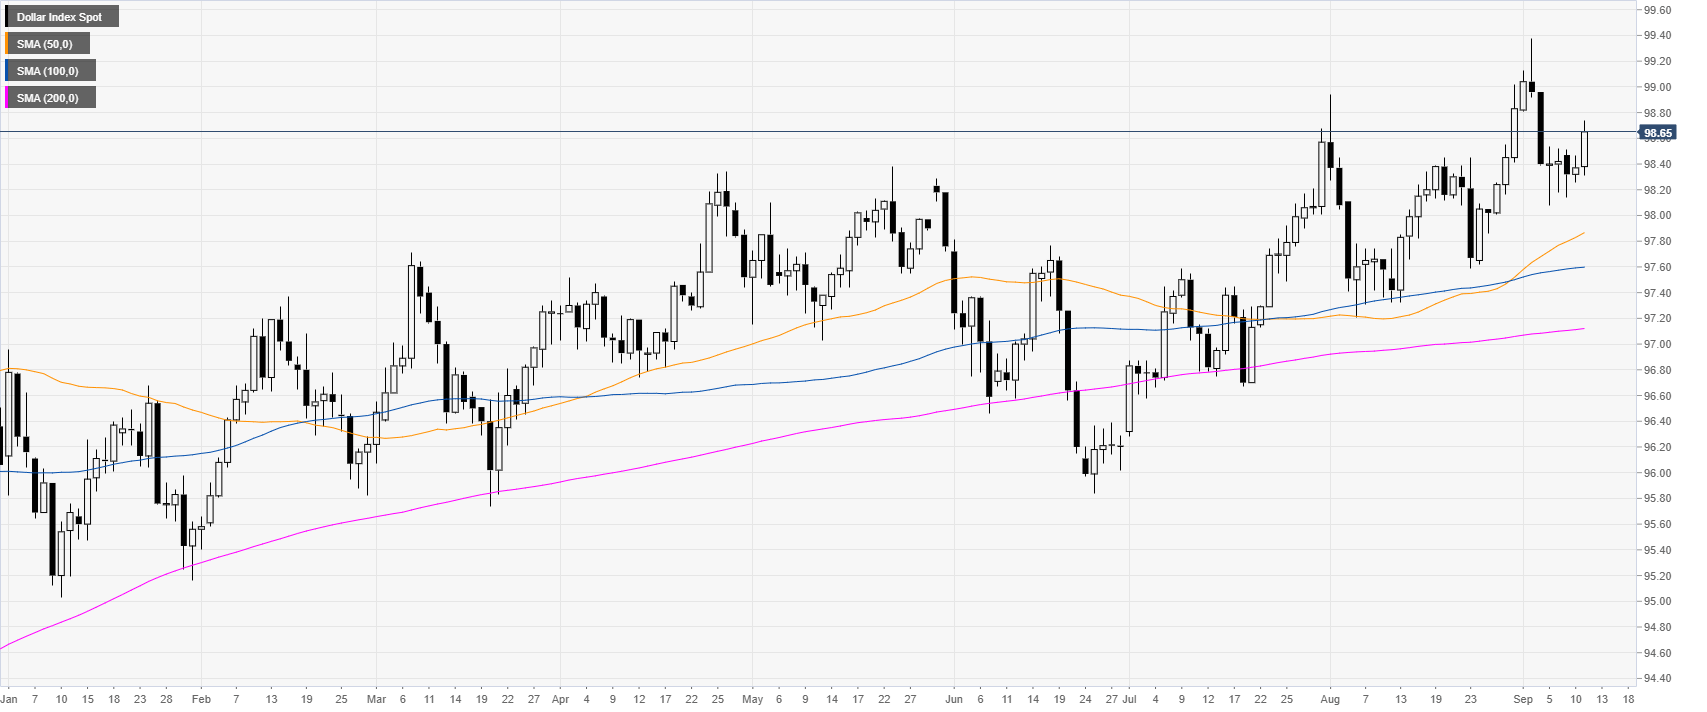
DXY daily chart
DXY (US Dollar Index) is trading in a bull trend above the main daily simple moving averages (DSMAs). The Greenback is picking up some steam as the 10-year US Bond Yields are trading at 3-week’s high.

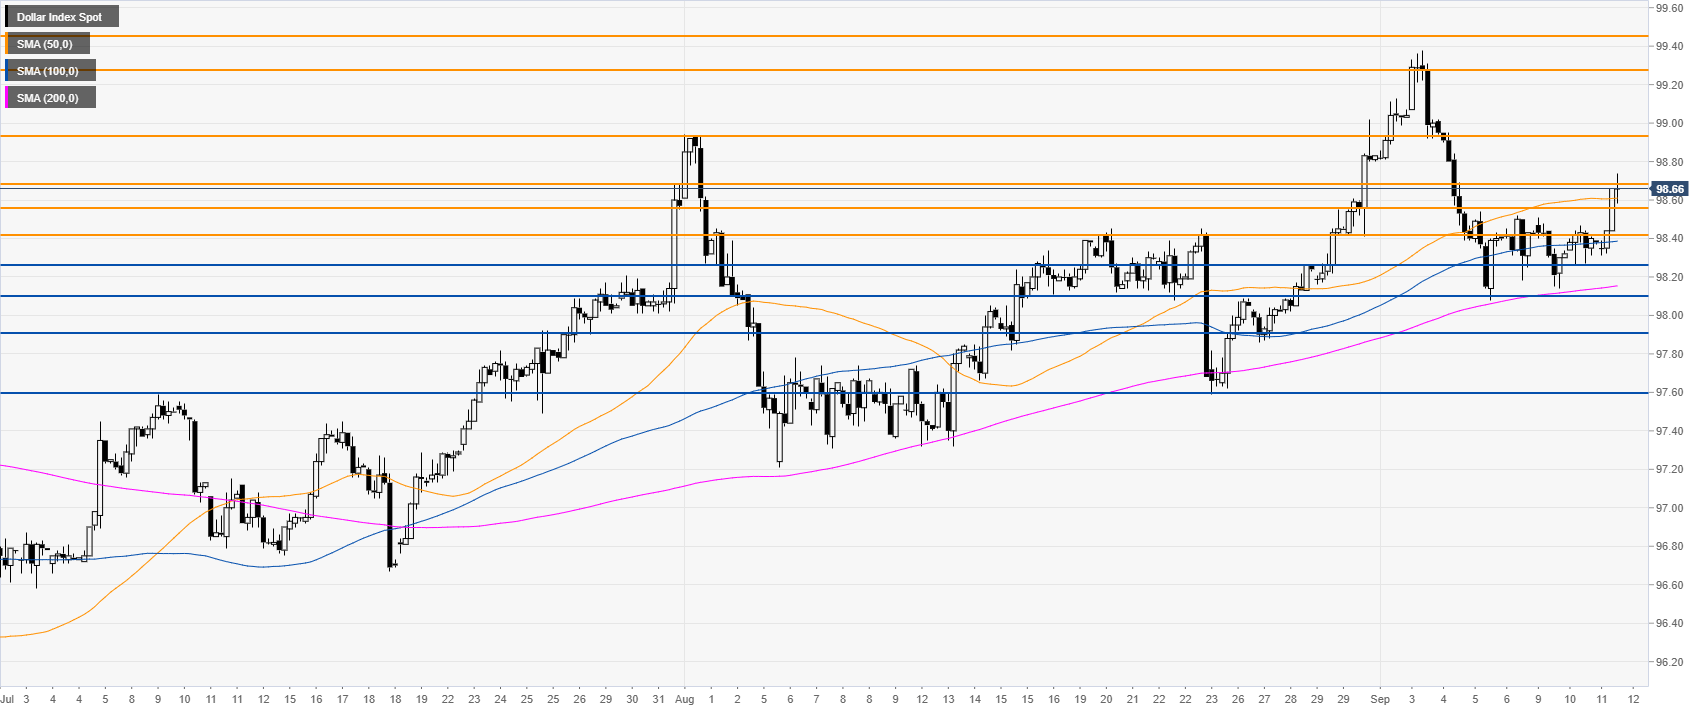
DXY four-hour chart
The US dollar Index broke above the 98.55 resistance and hit the 98.68 level this Thursday. As the market trades above its main SMAs, DXY might continue climbing towards 98.94 resistance level. If the bulls gather enough steam they could reach 99.28 resistance near the 2019 high.

DXY 30-minute chart
DXY is trading above its main SMAs, suggesting bullish momentum in the near term. Immediate support is seen at the 98.55 and 98.42 price levels.

Additional key levels
