Back
8 Oct 2019
GBP/USD technical analysis: Cable consolidating recent losses just above the 1.2200 handle
- GBP/USD is under pressure near the 1.2200 handle.
- Brexit: Three scenarios and GBP/USD price targets as B-Day approaches.
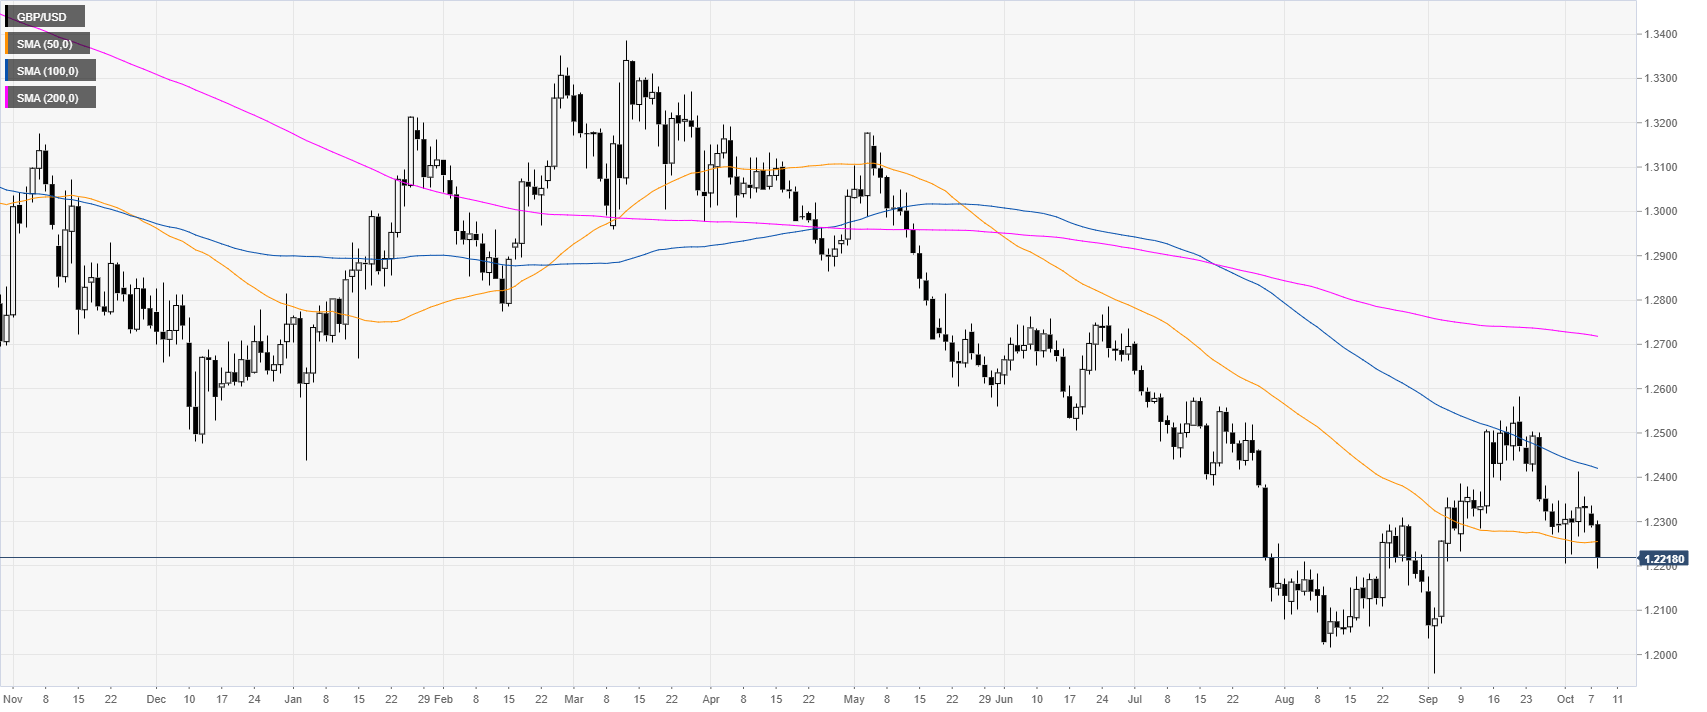
GBP/USD daily chart
On the daily chart, the Pound is trading in a downtrend below the main daily simple moving averages (DSMAs). The Sterling is weak as pessimism on pessimism over Brexit.
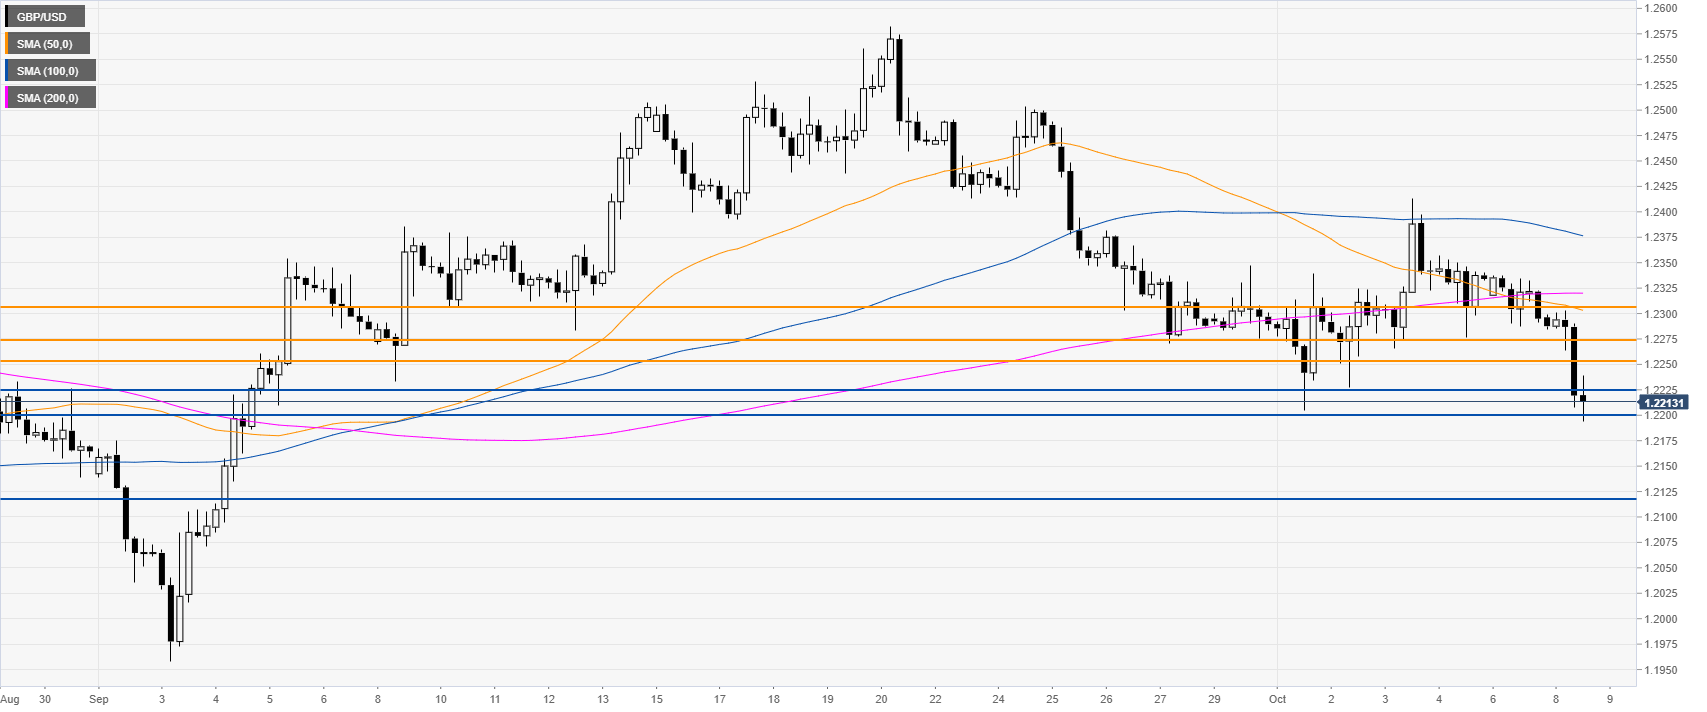
GBP/USD four-hour chart
GBP/USD is under bearish pressure below its main SMAs on the four-hour chart. The spot is challenging the 1.2224/20 support zone. A breakdown below this level could expose the currency pair to further losses towards the 1.2114 price level, according to the Technical Confluences Indicator.
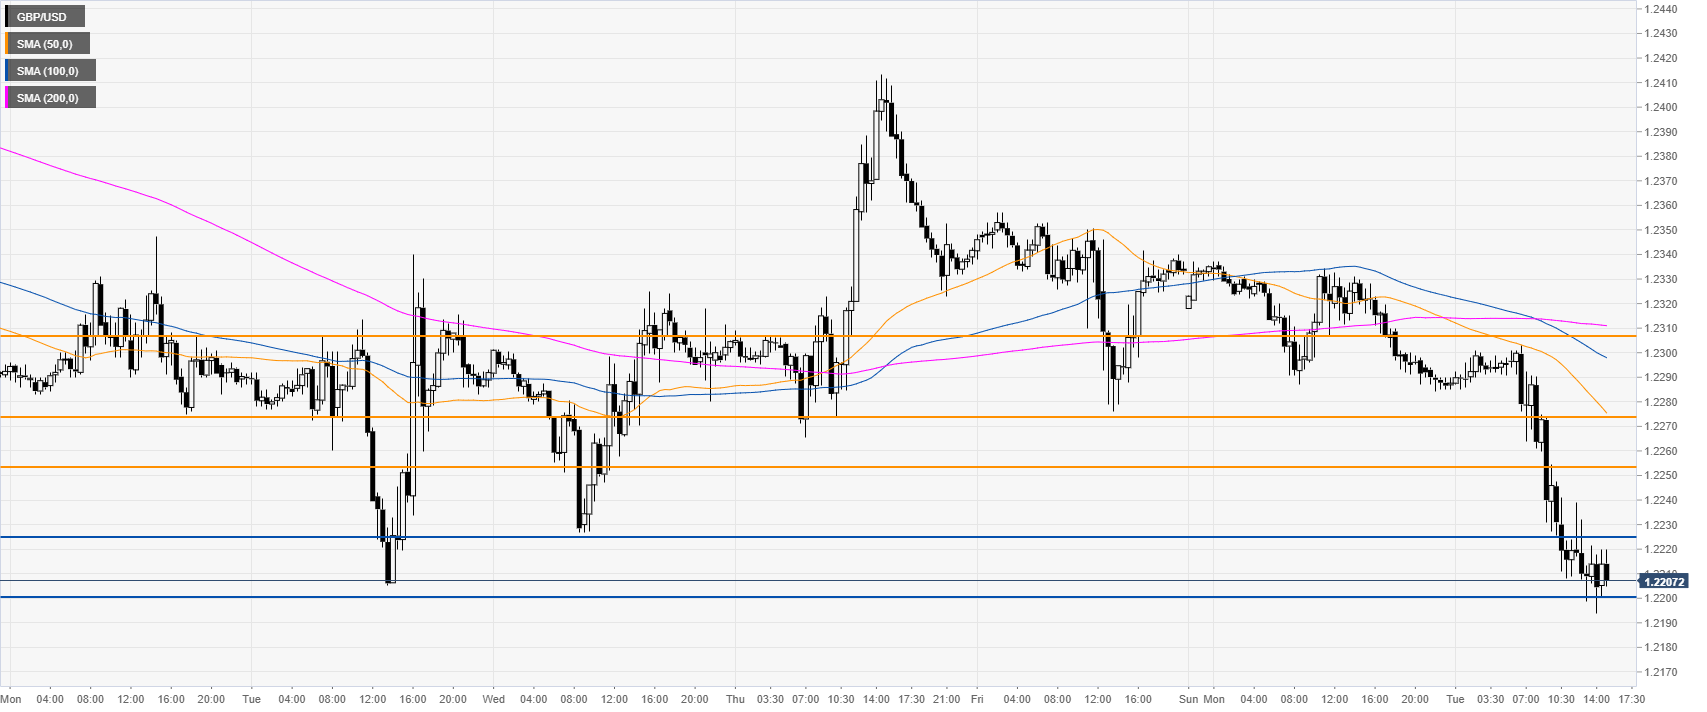
GBP/USD 30-minute
The Sterling is trading below its main SMAs, suggesting a downward bias in the short term. Immediate resistances are seen at 1.2253, 1.2276 and 1.2305 price levels, according to the Technical Confluences Indicator.
Additional key levels