Back
30 Oct 2019
USD/JPY technical analysis: Greenback awaiting the Fed’s decision near 109.00 handle
- USD/JPY is sidelined near multi-month highs near the 109.00 handle
- The level to beat for buyers is the 109.11 resistance.
- The Fed’s interest rate decision at 18:00 GMT is expected to rock the boat.
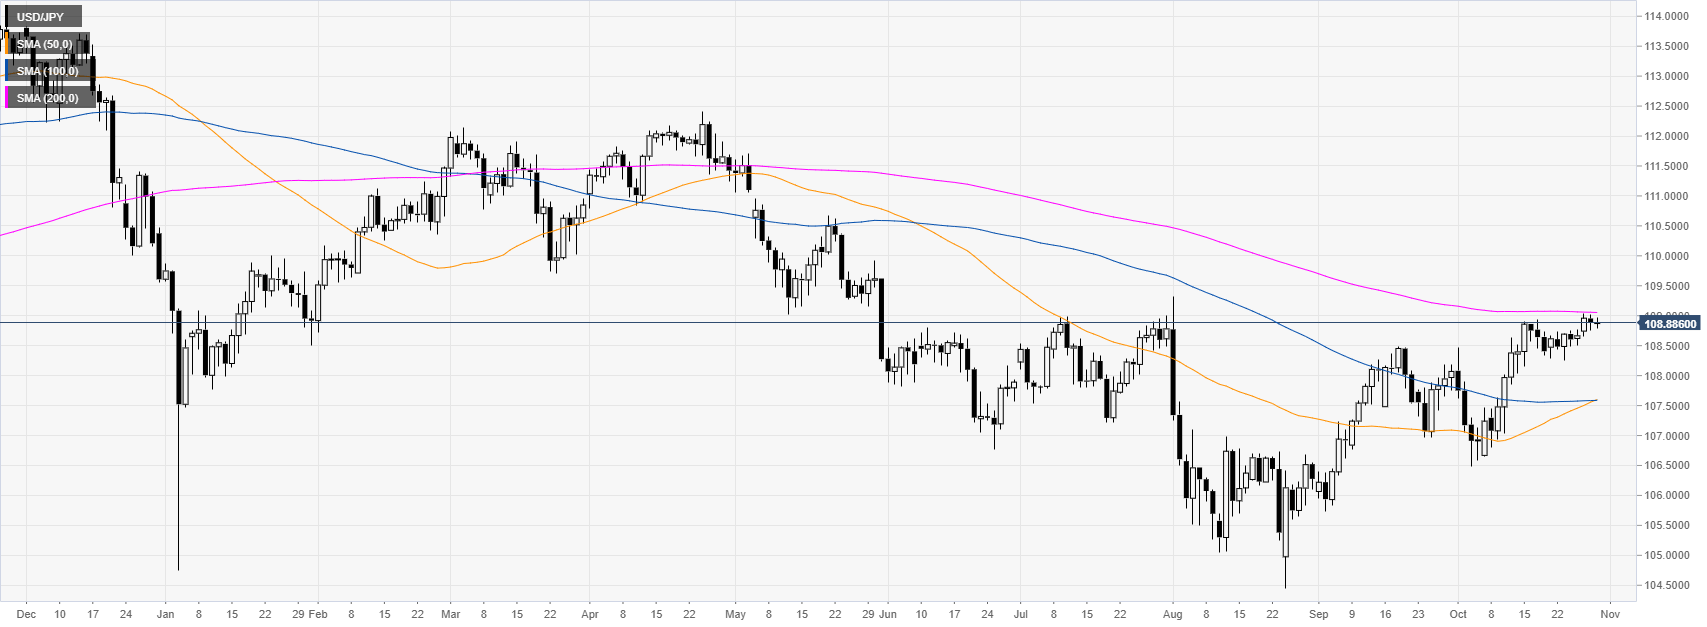
USD/JPY daily chart
USD/JPY is trading below its 200-day simple moving average (DMA) just below the 109.00 level. Since August, the market has been bouncing up sharply. However, the spot needs to overcome the 109.00 handle to open the doors to further gains. The market will pay close attention to the Fed’s interest rate decision this Wednesday at 18:00 GMT. A rate cut is priced in and investors will focus on the possibility or not of future rate cuts.
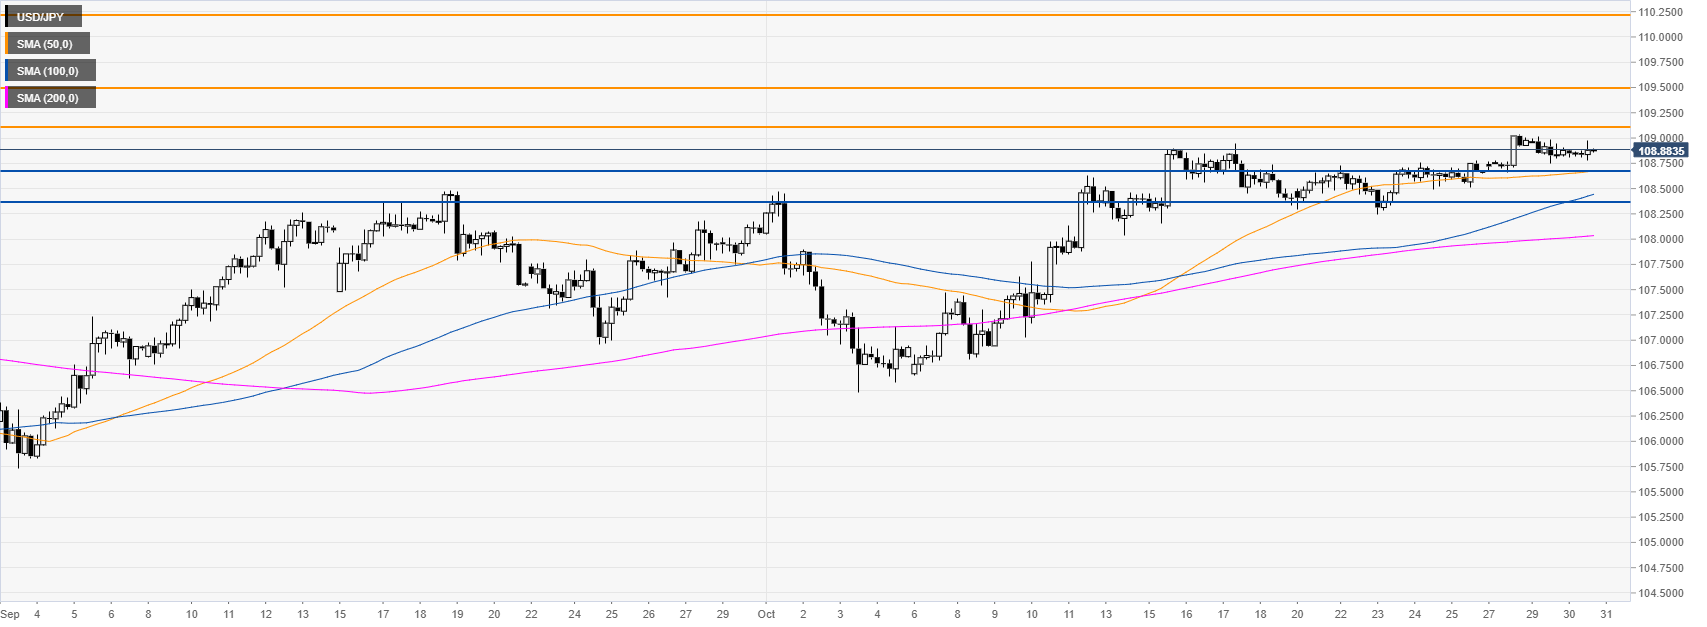
USD/JPY four-hour chart
USD/JPY is trading above its main SMAs on the four-hour chart, suggesting a bullish momentum in the medium term. Bulls want to overcome the 109.11 resistance to extend the bullish leg towards the 109.50 and 110.20 price levels, according to the Technical Confluences Indicator.
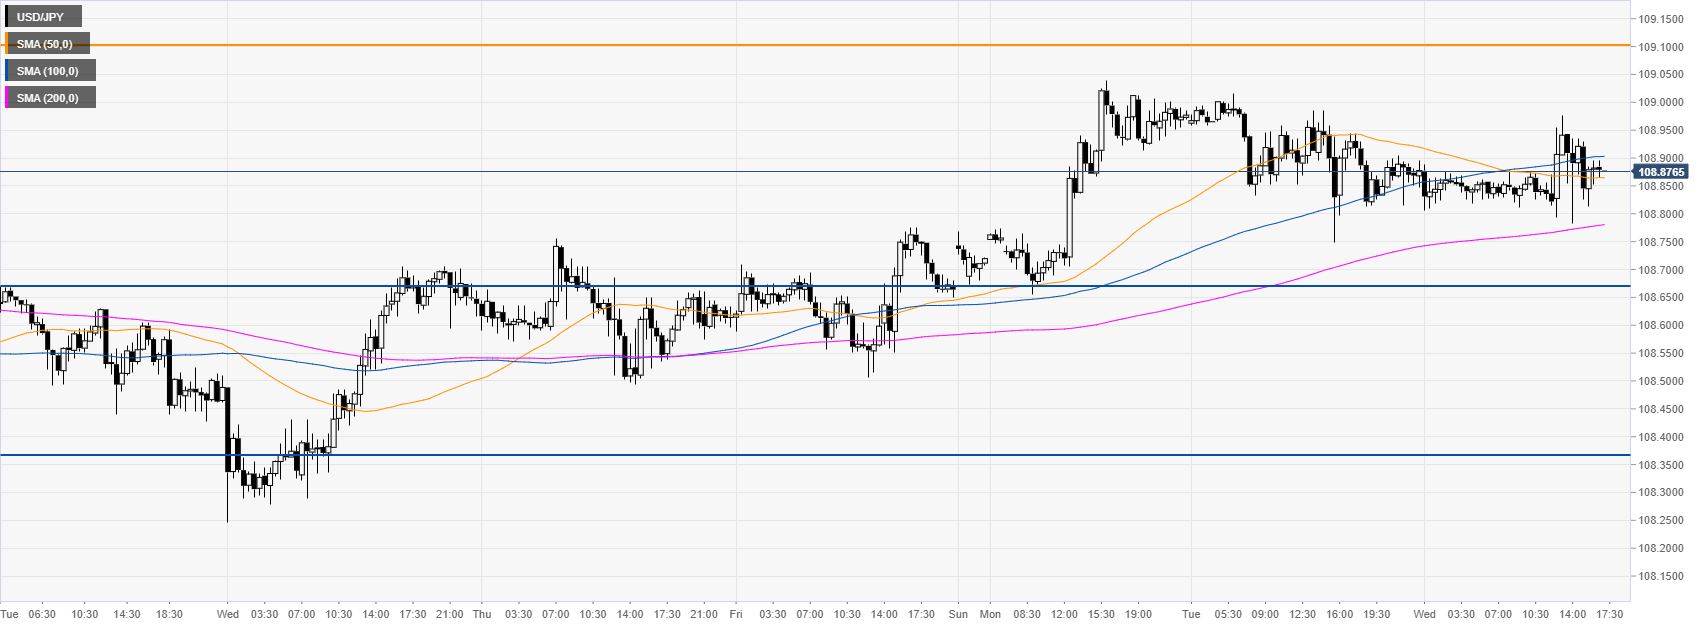
USD/JPY 30-minute chart
USD/JPY is trading above the 200 SMAs, suggesting a bullish bias in the near term. Support is seen at the 108.67 and 108.36 levels, according to the Technical Confluences Indicator.
Additional key levels