Back
27 Nov 2019
Gold Technical Analysis: Metal drops to session lows near $1455/oz, post-US GDP
- The metal is under bearish pressure in the New York session.
- US: GDP expanded 2.1% in Q3 (second estimate) vs. 1.9% expected.
- The outlook stays bearish in the medium term.
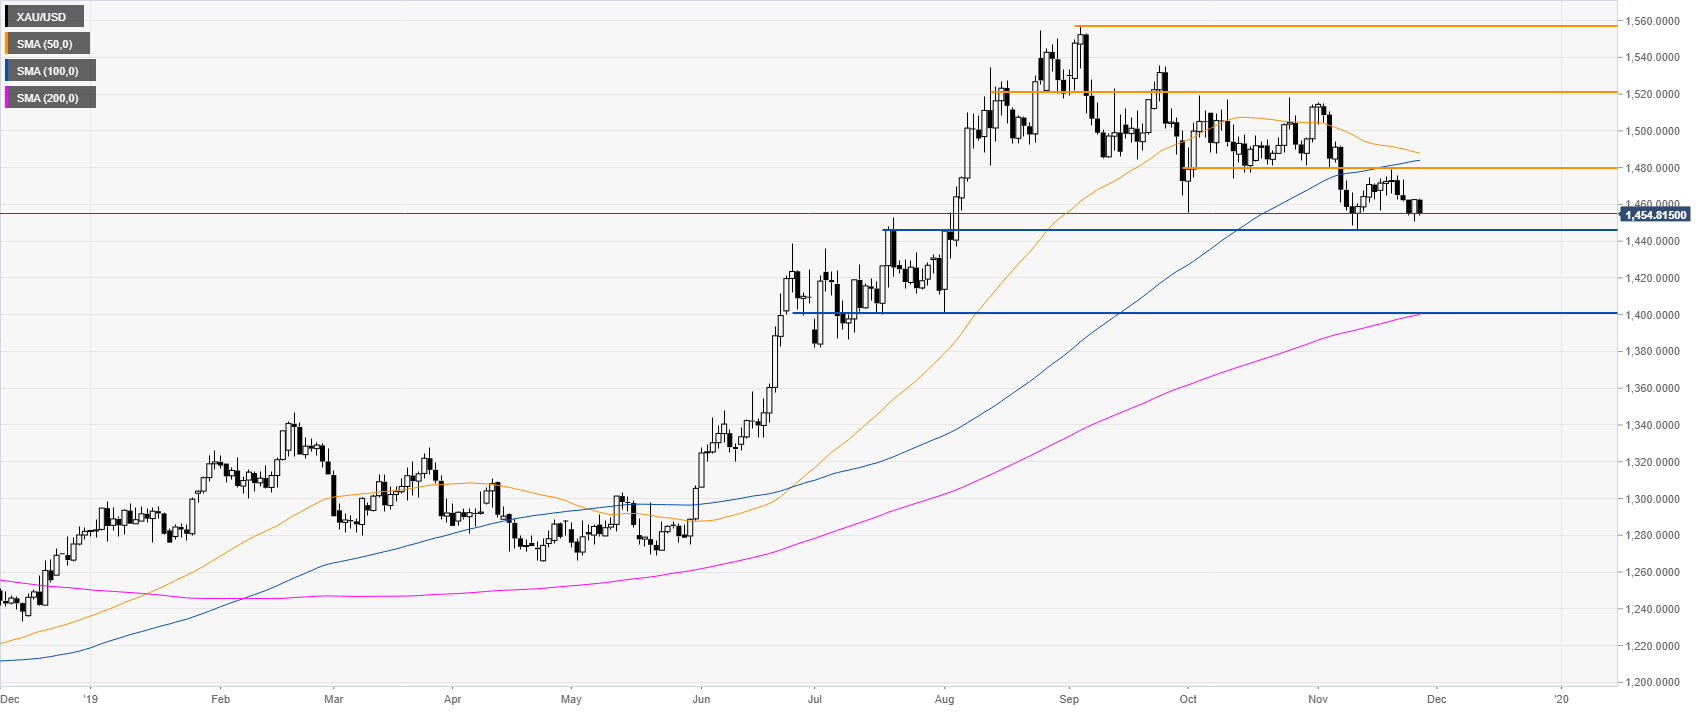
Gold daily chart
Gold is nearing the 1445 support level while trading below the 50 and 100 SMAs on the daily chart. A break below the 1445 swing low could drive the market to the next main support located near the 1400 handle. US: GDP expanded 2.1% in Q3 (second estimate) vs. 1.9% expected.
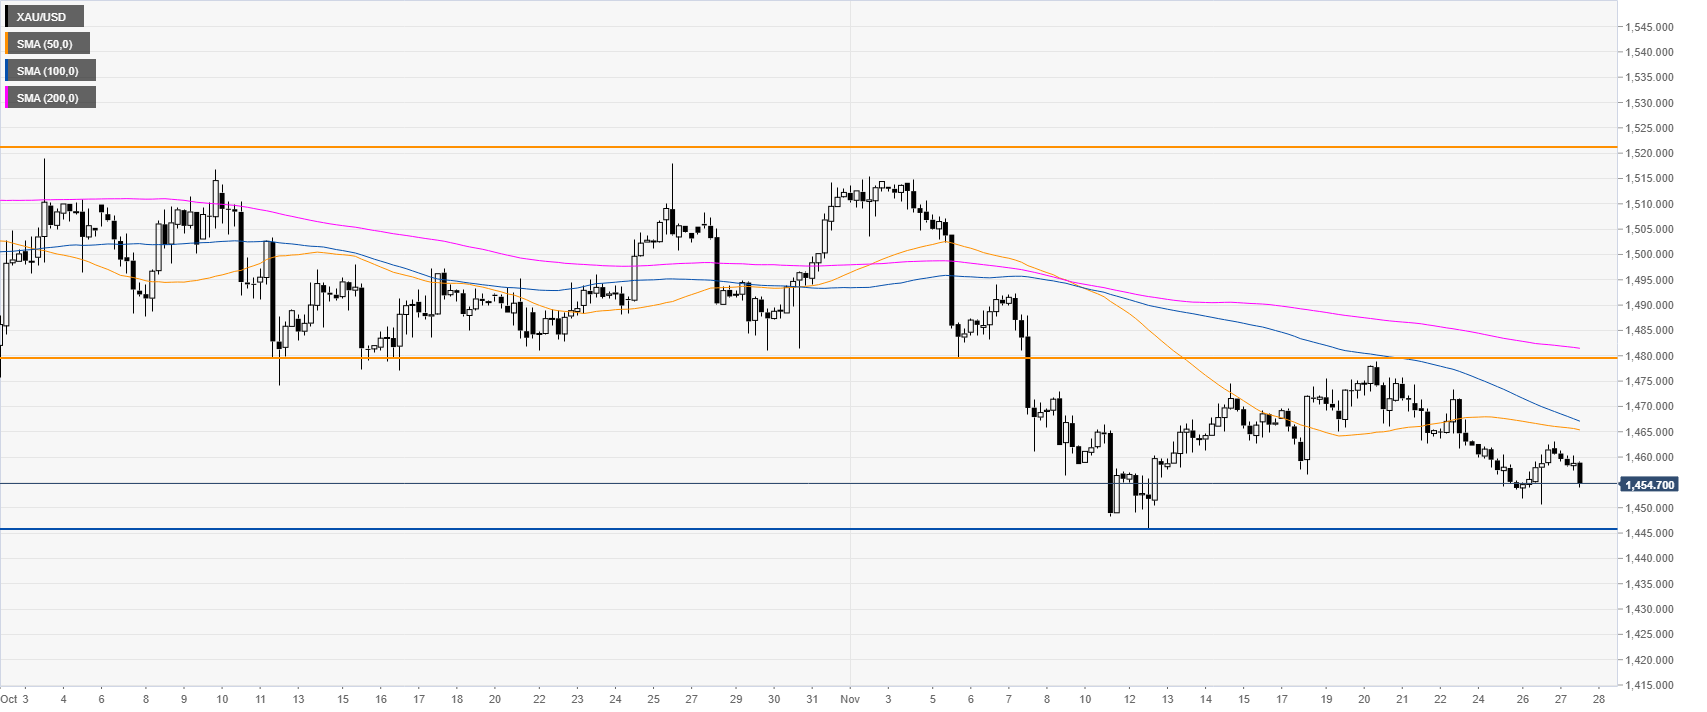
Gold four-hour chart
The market is under pressure while below the main SMAs. The 1445 level is likely on the bulls’ radar in the medium term. Immediate resistance is seen at the 1465 level.
Additional key levels