Back
3 Dec 2019
USD/INR Technical Analysis: Wednesday's close pivotal
- Monday's candlestick has weakened the immediate bullish case.
- A close above Monday's high of 71.8090 is needed to revive the bullish setup.
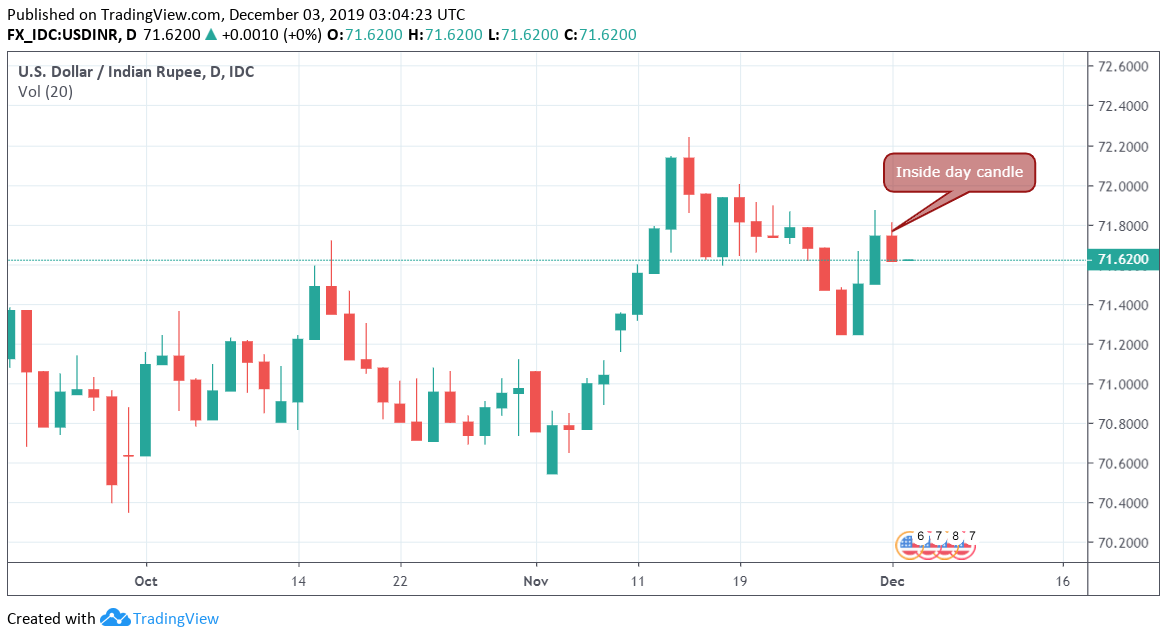
USD/INR created an inside day candlestick pattern on Monday, signaling indecision in the market place.
The candlestick pattern has weakened the immediate bullish view put forward by Friday's falling channel breakout.
A close above 71.81 (inside day's high) would imply the indecision or consolidation has ended with a bullish breakout. Put simply, it would signal a continuation of the rally from the Nov. 28 low of 71.2490 and open the doors for a convincing move above 72.00.
On the flip side, acceptance below the inside day's low of 71.6190 may attract stronger selling pressure.
A bullish close looks likely as the Indian equities are likely to post losses, tracking the decline in the US stocks.
Daily chart

Trend: Neutral
Technical levels
