USD/JPY Technical Analysis: 100-bar SMA keeps buyers hopeful
- USD/JPY is on the recovery mode, trades around intra-day high.
- 61.8% Fibonacci Retracement adds to the support while 110.00 keeps troubling the Bulls.
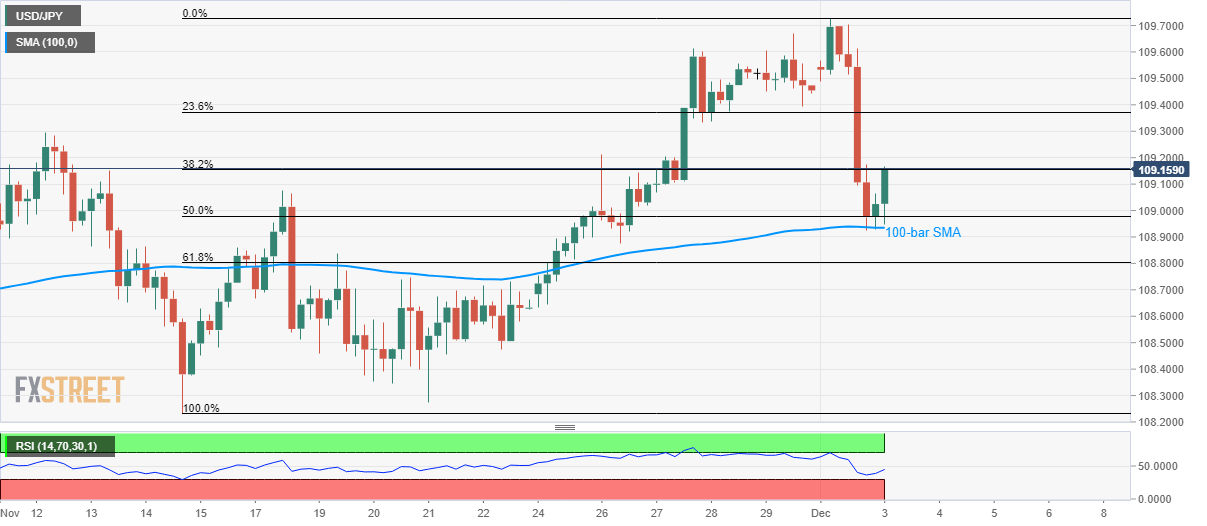
USD/JPY takes the bids to an intra-day high of 109.15 by the press time of early Tuesday. The quote recently bounced off 100-bar Simple Moving Average (SMA).
Considering sharp declines registered during the previous day, coupled with a pullback from the key SMA, prices are likely to extend the recovery towards 23.6% Fibonacci retracement of late-November upside, near 109.40. Though, 110.00 could keep being a tough nut to crack for buyers afterward.
In a case of the Bulls’ capacity to conquer 110.00 round-figure, May 21 high around 110.70 will be in the spotlight.
Alternatively, the 100-bar SMA level of 108.93 and 61.8% Fibonacci retracement level of 108.80 restrict pair’s immediate declines whereas multiple lows surrounding 108.40 could keep sellers entertained then after.
USD/JPY 4-hour chart
Trend: Recovery expected