WTI Price Analysis: Oversold RSI can stop bears targeting 61.8% Fibonacci
- WTI seesaws near 15-week low flashed the previous day.
- Oversold RSI could repeat patterns registered from early-January 2019.
- $57.35/25 becomes the key resistance confluence.
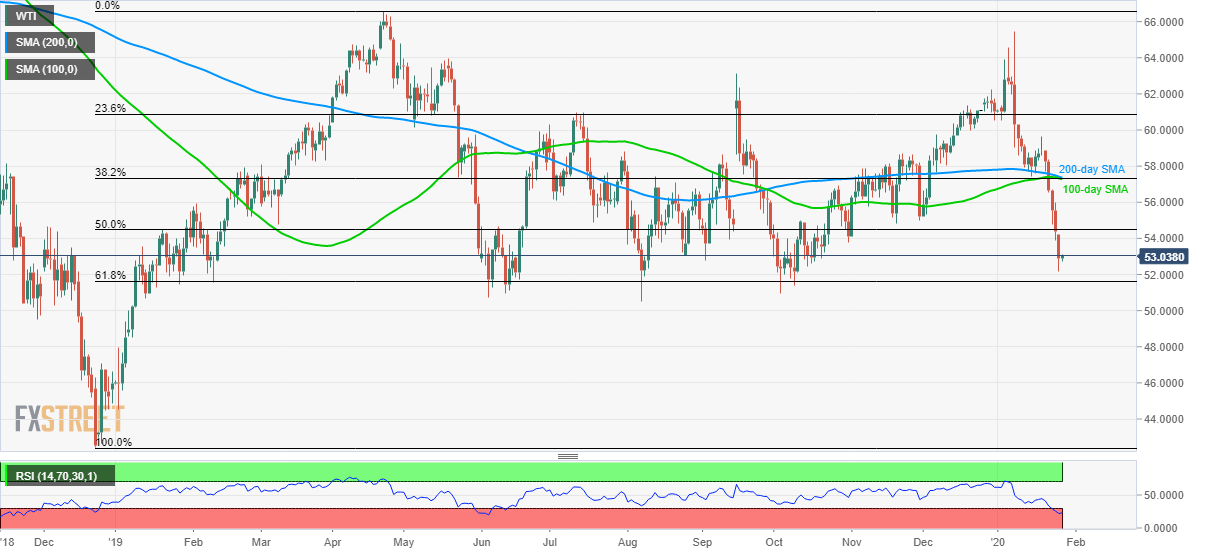
WTI bears catch a breath as the quote flashes $53.00 during the initial trading session on Tuesday. The energy benchmark recently dropped to the lowest since October and is declining towards 61.8% Fibonacci retracement of its upside from December 2018 to April 2019.
Even so, overbought conditions of RSI can help repeat the bounces off $51.60 key Fibonacci level, if not then $50.00 could try disappointing the sellers.
In a case where the black gold continues to linger beneath $50.00, high marked on December 26, 2018, near $47.00 will be in the spotlight.
On the flip side, a 50% Fibonacci retracement level of $54.50 could please the short-term buyers during the pullback.
However, a confluence of 100 and 200-day SMA, as well as 38.2% Fibonacci retracement, will cap the rise around $57.25/35, if not then a fresh run-up towards $60.00 could be expected.
WTI daily chart
Trend: Pullback expected