USD/CAD Price Analysis: Holds onto recovery gains from 21-day SMA
- USD/CAD remains mildly bid near the three-day top.
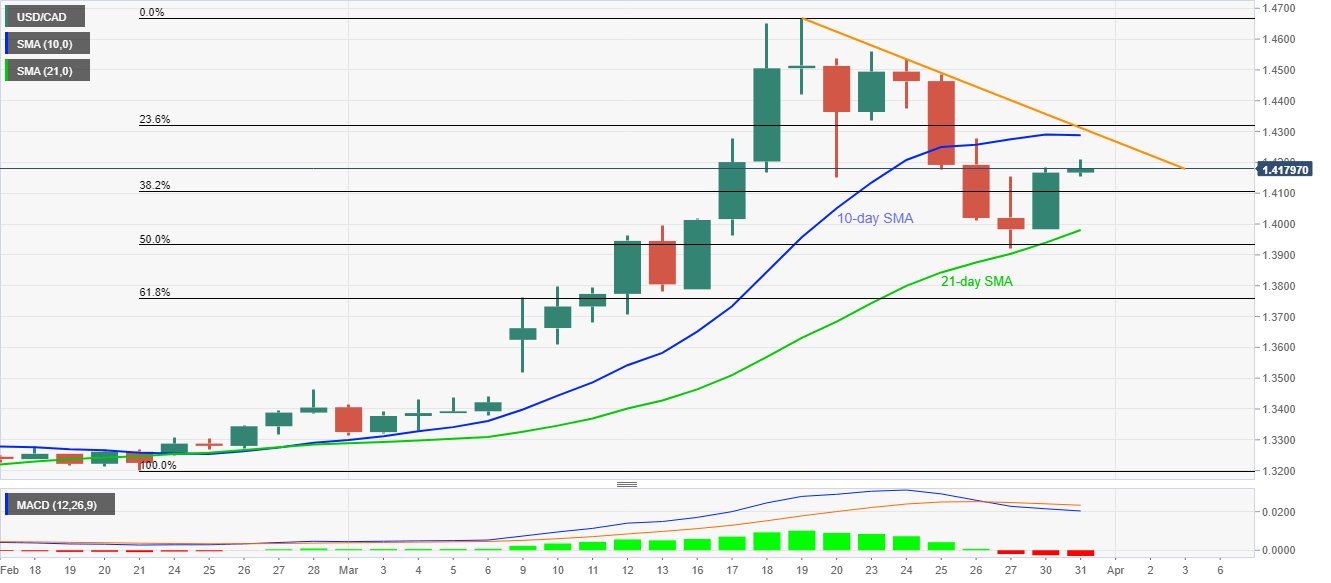
- The pair extends run-up from 21-day SMA but stays below 10-day SMA amid bearish MACD.
- 23.6% Fibonacci retracement, eight-day-old falling trend line adds to resistance.
USD/CAD registers 0.10% gains while extending the previous day’s pullback from 21-day SMA to 1.4180 amid the pre-Europe session on Tuesday.
While 10-day SMA near 1.4290 is on the buyers’ radars, 23.6% Fibonacci retracement of the pair’s upside between February 21 and March 19, coupled with short-term falling trend line around 1.4320/25 will limit the pair’s further upside.
If at all buyers manage to cross 1.4325 on a daily closing basis, 1.4370, 1.4420 and 1.4560 can check buyers ahead of offering them the monthly top near 1.4670.
On the contrary, bearish MACD can help the sellers question 61.8% Fibonacci retracement level of 1.3760 if USD/CAD prices flash a daily close past-21-day SMA level of 1.3980.
It should also be noted that the early-month gap near 1.3440 will be in the market’s attention if the quote stays weak below 1.3760.
USD/CAD daily chart
Trend: Sideways