USD/CAD Price Analysis: Friday’s Hanging Man candle probes recoveries above 1.3600
- USD/CAD shrugs off Friday’s weakness to take the bids past-1.3600.
- The bearish candlestick formation suggests the pair’s pullback.
- Bullish MACD indicates a further rise towards 100-day SMA.
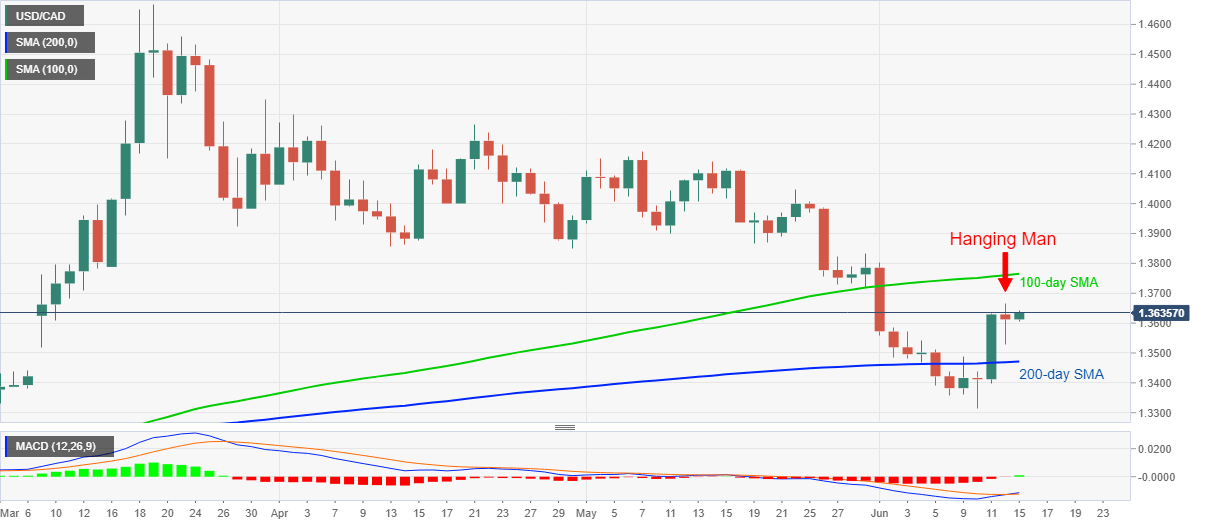
USD/CAD is on the bids near 1.3640, up 0.20% on a day, amid Monday’s Asian session. On Friday, the Loonie pair flashed a bearish candlestick formation on the daily chart, which in turn can question the pair’s current recovery moves. It’s worth mentioning that the quote’s fresh run-up might have taken clues from the bullish MACD as well as the pair’s sustained trading above 200-day SMA.
As a result, buyers will remain cautious unless the pair crosses June 12 high near 1.3670, a break of which can escalate the current rise towards a 100-day SMA level of 1.3765.
During the pair’s extended rise above 100-day SMA, the late-May top surrounding 1.3830 and April 30 low of 1.3850 could lure the bulls.
On the contrary, the 200-day SMA level of 1.3470 will pop-up on the sellers’ radars during the quote’s fresh downside.
Though, a daily closing below 1.3470 might not refrain from challenging the monthly low near 1.3320/15.
USD/CAD daily chart
Trend: Pullback expected