NZD/USD Price Analysis: Further downside needs 0.6980 break
- NZD/USD grinds lower around five-week low, retreats of late.
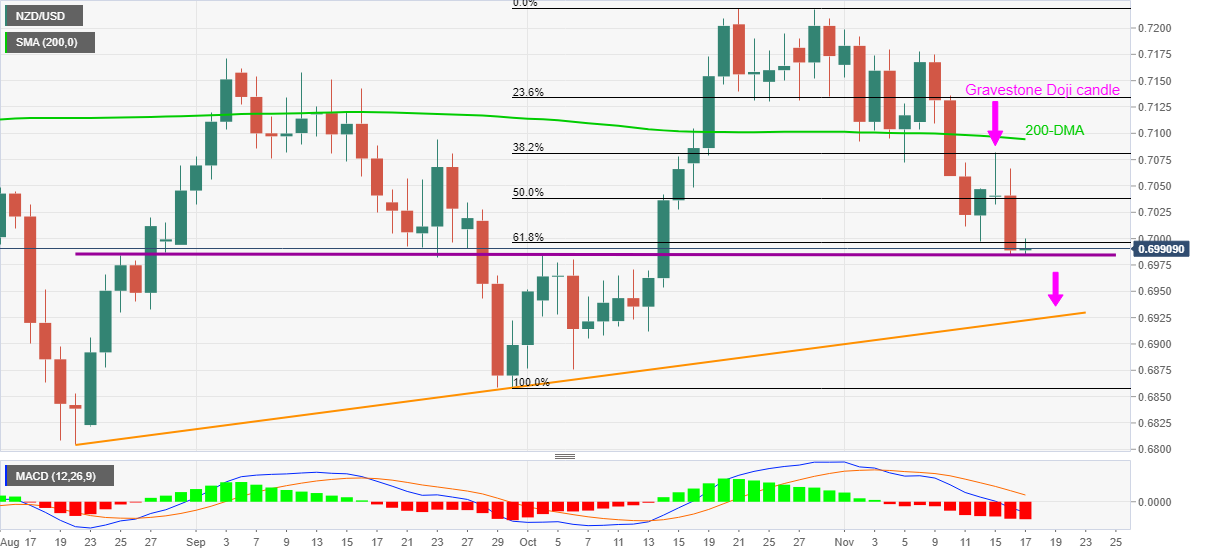
- Bearish candlestick, sustained trading below 200-DMA, 61.8% Fibo. favor sellers.
- Three-month-old support line on seller’s radar amid bearish MACD signals.
NZD/USD struggles to recovery as bears take a breather around monthly low, retreating to 0.6990 during early Wednesday.
The kiwi pair dropped the most in a week the previous day while justifying Monday’s bearish candlestick formation, as well as sustained trading below the key 200-DMA.
The declines broke 61.8% Fibonacci retracement (Fibo.) of September-October upside but a horizontal line from late August tests the NZD/USD pair of late.
However, bearish MACD signals keep sellers hopeful of conquering the 0.6980 immediate support, which in turn will direct the downtrend towards an ascending support line from August 20, near 0.6920.
Alternatively, corrective pullback needs a daily closing beyond the 61.8% Fibo. level of 0.7000 to direct the NZD/USD buyers towards the 50% Fibonacci retracement level of 0.7040.
Even so, the upside momentum remains challenged until crosses the 200-DMA surrounding 0.7095.
NZD/USD: Daily chart
Trend: Further weakness expected