AUD/JPY Price Analysis: Monitoring for the next waterfall sell-off
- AUD/JPY has been battered this week but there could still be plenty to go.
- The cross is a risk-off and high beta pair, so inflation risks matter.
AUD/JPY, the forex market's risk barometer, is meeting a critical level of daily support that if broken will potentially lead to the next waterfall sell-off. Inflation concerns are weighing on the pair and the Aussie is out of favour due to the central bank divergences. The following illustrates the latest price action and what could be in store next.
AUD/JPY daily chart

As illustrated, there is potentially a lot of room to go to the downside at this juncture. However, a correction could be in order first:
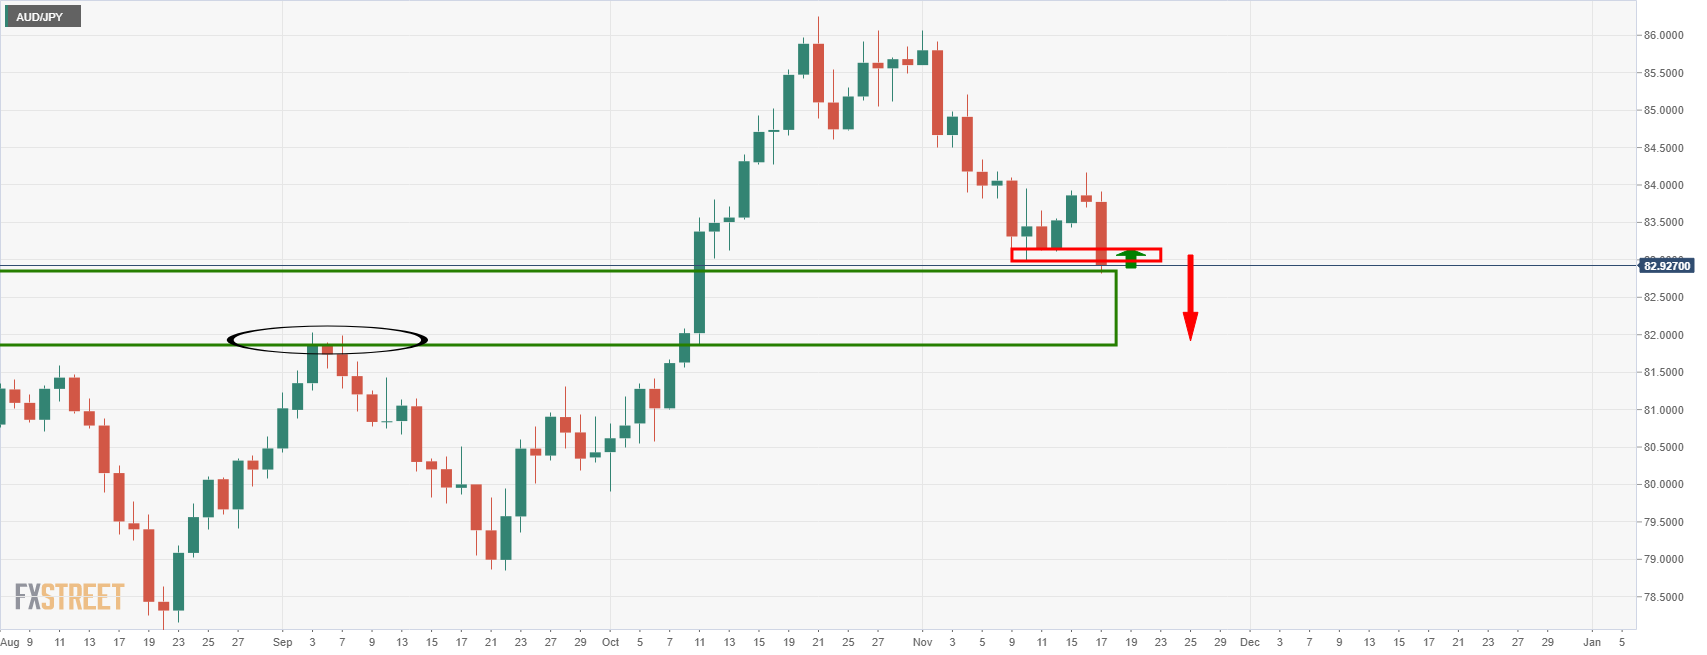
A correction to the old support near 83.16 is probable.
AUD/JPY H1 chart
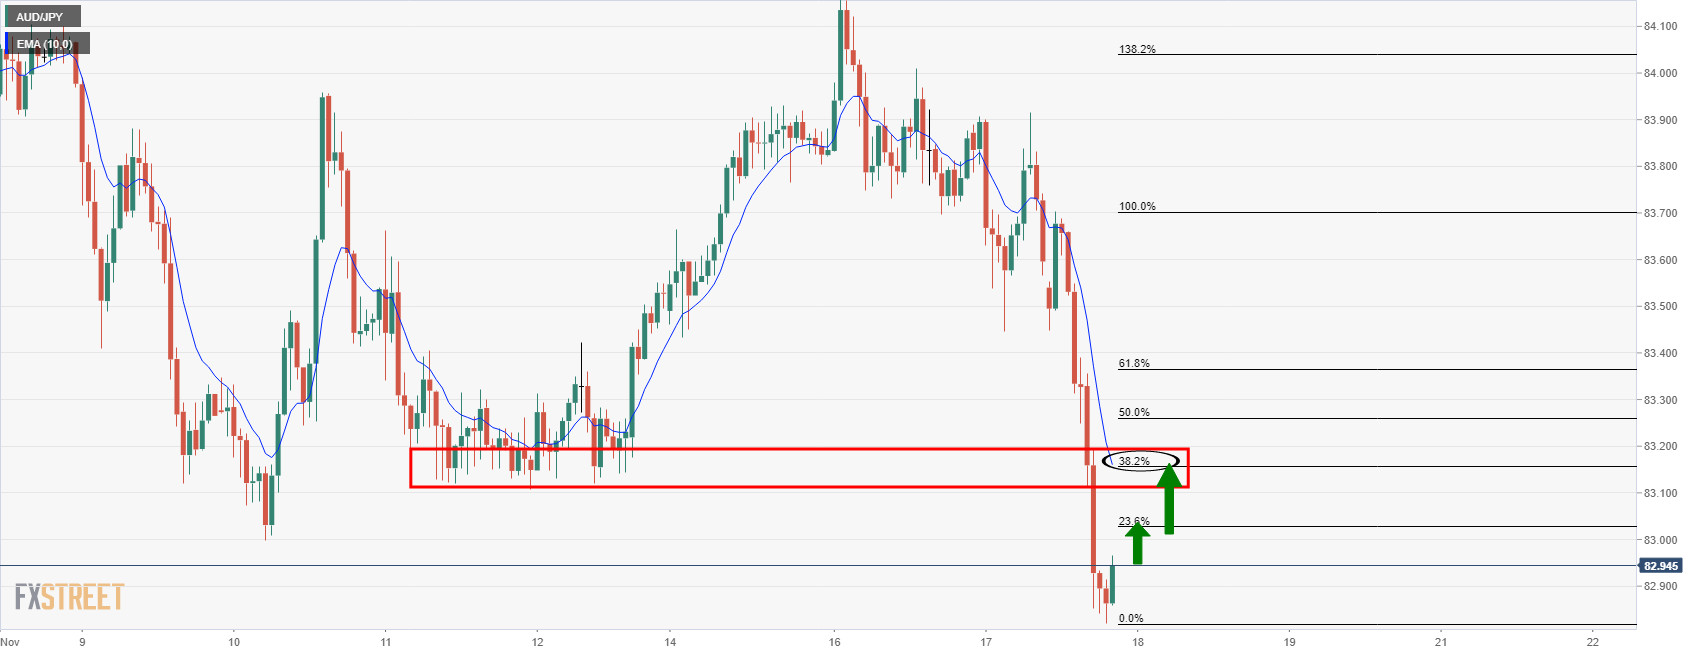
A correction to the old support, as illustrated on the hourly chart above, has a confluence with the 38.2% Fibonacci level. This would be expected to hold and in doing so, attract bears which would result in further supply and a downside continuation in the price for the sessions ahead.