GBP/USD Price Analysis: Bulls throwing in the towel at weekly resistance
- GBP/USD is meeting a weekly area of resistance.
- The bears are engaging as seen on the lower term time frames.
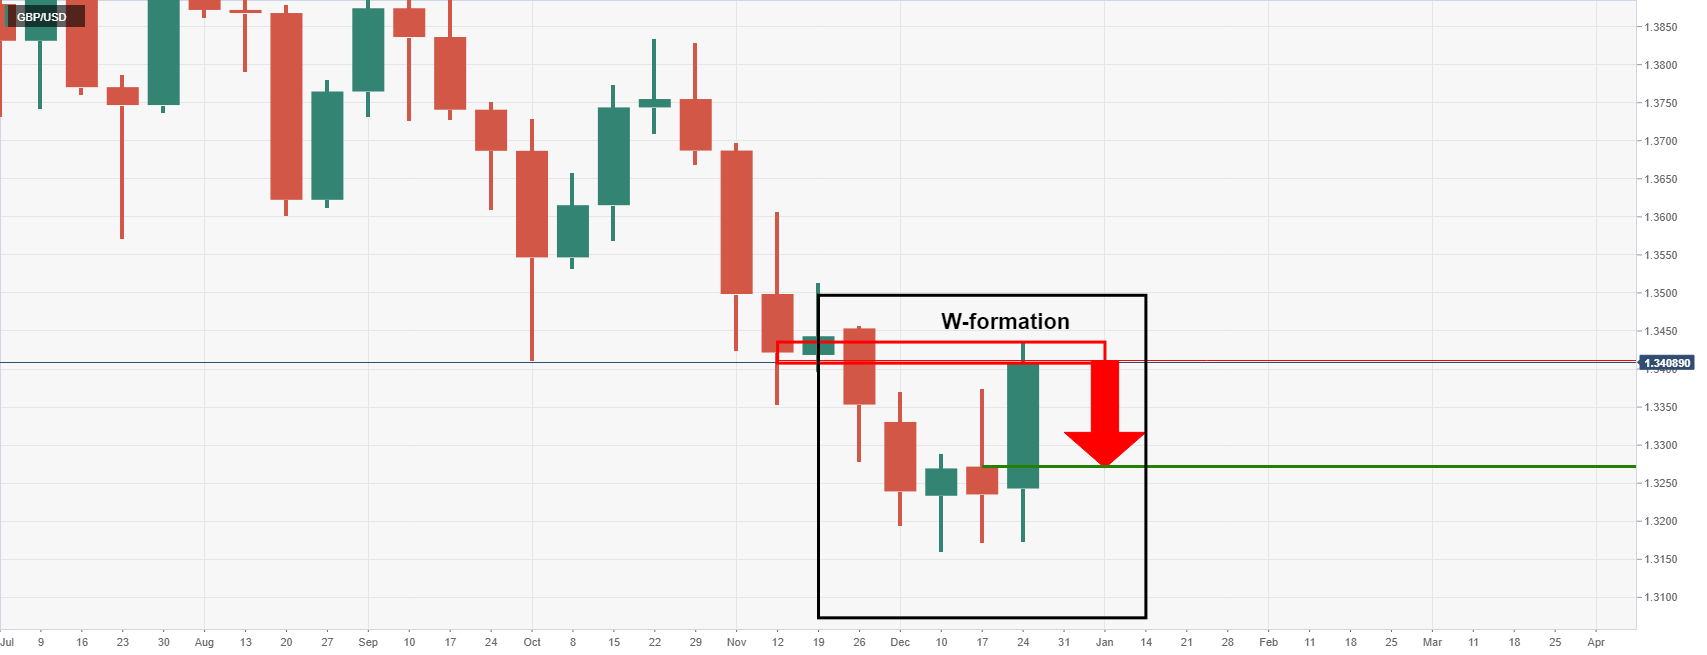
GBP/USD has rallied into a weekly order block from where some meanwhile consolidation would be expected to unfold in the coming sessions. The following illustrates the W-formation that has been left on the weekly chart which is a reversion pattern. The neckline of the W-formation would be expected to be retested.
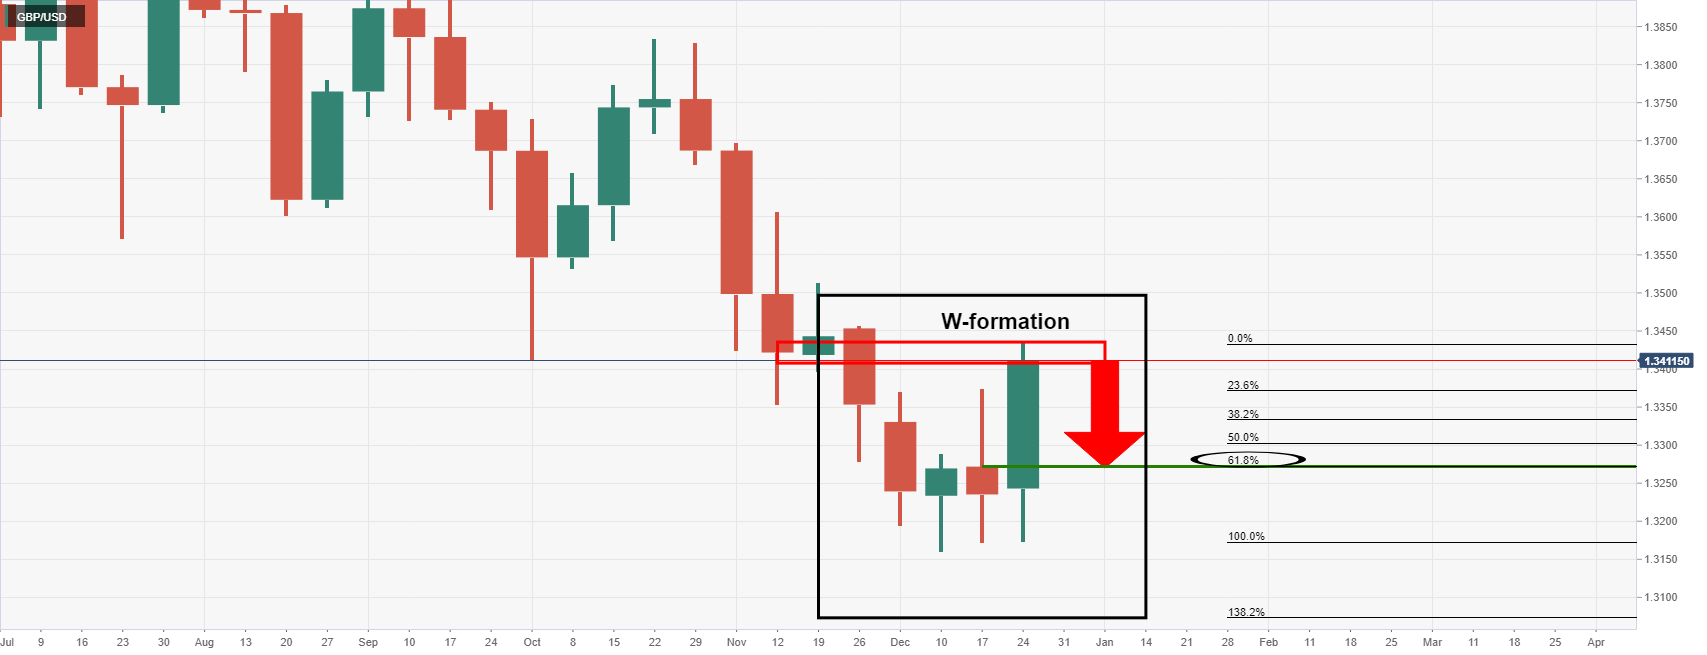
GBP/USD weekly chart
Drawing the Fibonaccis and measuring the bullish impulse, the 61.8% Fibo aligns with the neckline which offers a confluence for which traders will note:
GBP/USD daily chart
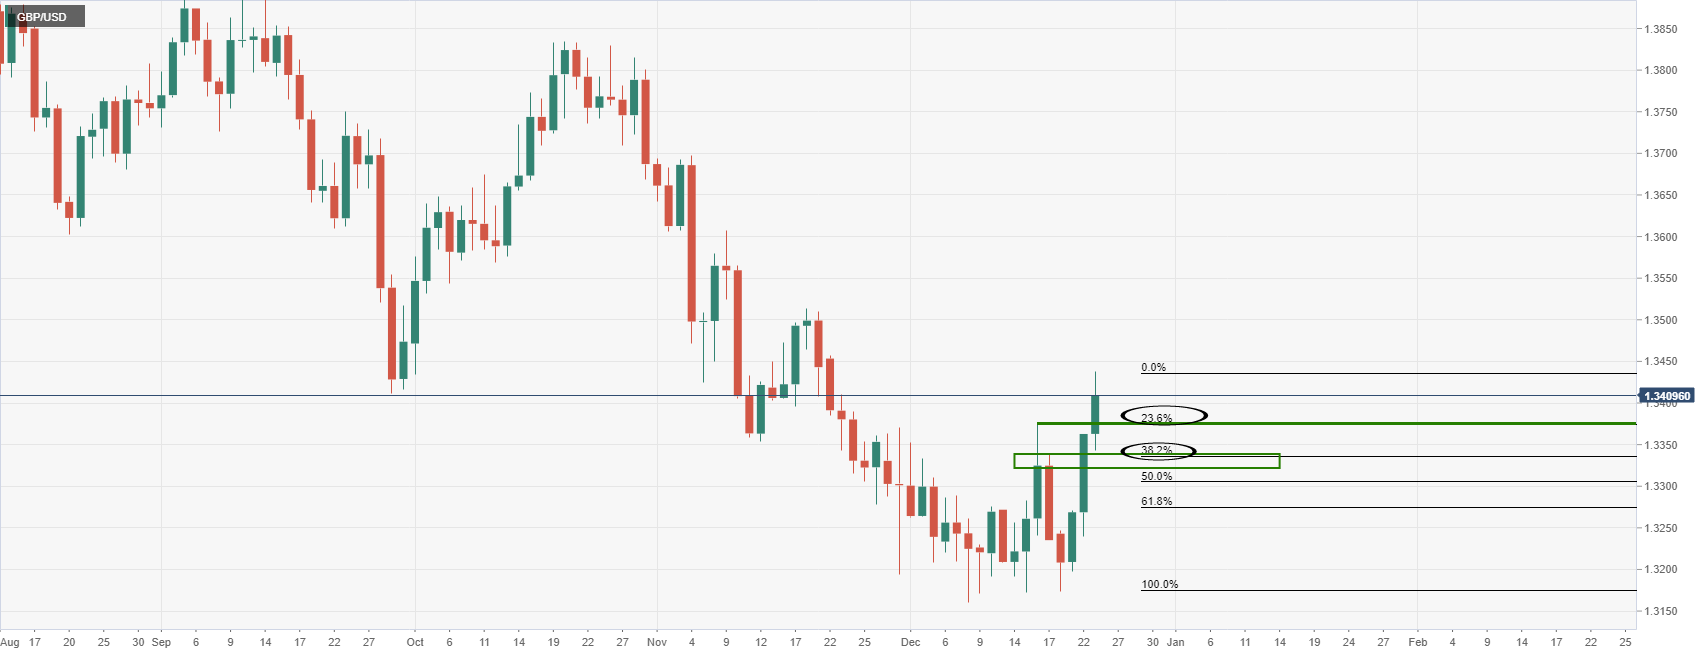
The price on the daily chart, however, provides a structure that would be expected to act as support higher up the Fibo scale. For instance, there is a bullish spike, the true top of the W-formation's neckline, located at 1.3375. This aligns with the 23.6% Fibo. Lower, the next level of resistance 1.3320/35 aligns near to the 38.2% Fibo and structure, as illustrated above.
GBP/USD H1 chart
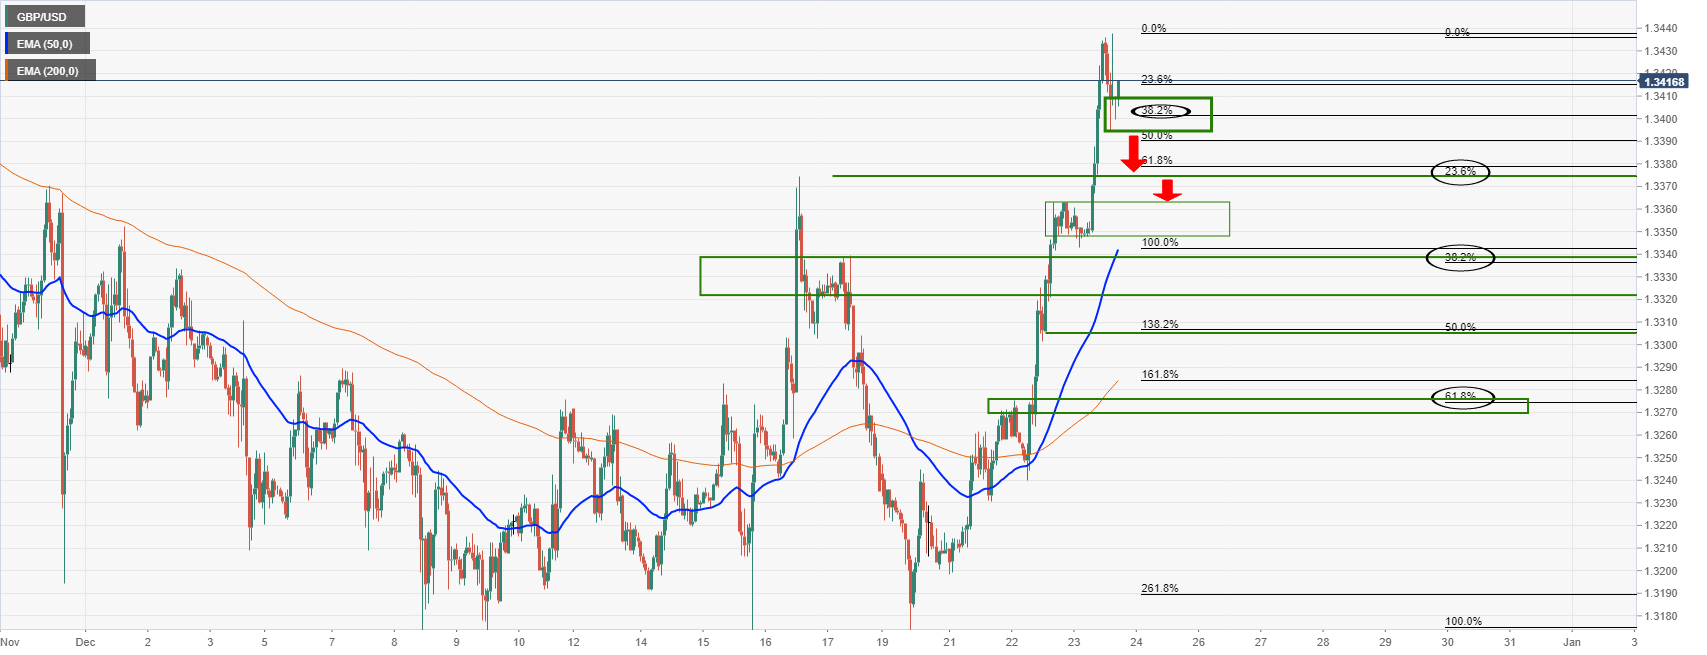
The hourly chart is full of various structures on the downside. In regular market conditions, these areas would be expected to act as support on the way to a test of the 50-EMA or on towards the 200-EMA, both of which align with the weekly chart's W-formation's structure and the daily chart's supports.